
Last major update issued on February 29, 2004 at 04:30 UTC.
[Solar and geomagnetic data - last month (updated daily)]
[Solar wind and electron fluence charts (updated daily)]
[Solar cycles 21-23 (last update February 2, 2004)]
[Solar cycles 1-20]
[Graphical comparison of cycles 21, 22 and 23 (last update February 2, 2004)]
[Graphical comparison of cycles 2, 10, 13, 17, 20 and 23 (last update February
2, 2004)]
[Historical solar and geomagnetic data charts 1954-2003 (last update January 16,
2004)]
[Archived reports (last update February 26, 2004)]
The geomagnetic field was quiet to minor storm on February 28. Solar wind speed ranged between 423 and 635 km/sec under the influence of a high speed stream from coronal hole CH83. As I write this solar wind speed has increased to above 700 km/sec.
Solar flux measured at 20h UTC on 2.8 GHz was 115.8. The planetary A
index was 20 (STAR Ap - based on the mean of three hour interval ap indices: 21.0).
Three hour interval K indices: 23543433 (planetary), 23533434 (Boulder).
The background x-ray flux is at the class B2 level.
At midnight there were 4 spotted regions on the visible disk. Solar flare activity was low. A total of 3 C class events was recorded during the day.
Region 10564 decayed fairly quickly losing penumbral area and spots. There is still a weak magnetic delta structure in
the northern central part of the region. An M class flare is
possible. Flare: C2.9 at 17:27 UTC.
Region 10565 decayed significantly and is quickly losing the trailing spots.
Region 10567 developed in the trailing spot section while losing penumbra on the leader spots. Flares:
C2.2 at 11:53 and C1.6 at 17:10 UTC.
New region 10568 emerged on February 27 in the southwest quadrant and was numbered the next day by SEC. The region decayed
on February 28 and could soon become spotless.
February 26-28: No partly or fully earth directed CMEs observed.
Coronal hole history (since late October 2002)
Compare today's report with the situation one solar rotation ago: 28
days ago 27 days ago 26 days ago
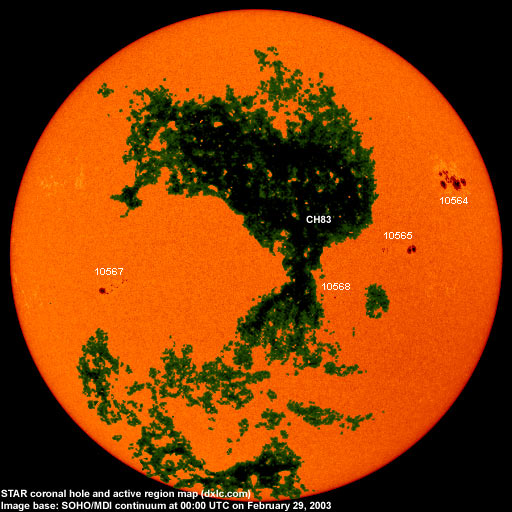
A well defined recurrent trans equatorial coronal hole (CH83) was into a geoeffective position on February 26-29.

Processed SOHO/EIT 284 image at 01:06 UTC on February 29. The darkest areas on the solar disk are likely coronal holes.
The geomagnetic field is expected to be quiet to minor storm on February 29-March 2 due to a high speed stream from coronal hole CH83.
Long distance low and medium frequency (below 2 MHz) propagation along east-west paths over high and upper middle latitudes is poor. Propagation along long distance north-south paths is fair. [Trans Atlantic propagation conditions are currently monitored every night on 1470 kHz. Dominant station tonight: Radio Vibraci�n (Venezuela). Nice signals noted from other stations in Venezuela: Radio Calendario on 1020 kHz and Radio Car�pano on 1110 kHz. The only North American station with a good signal was CJYQ "Radio Newfoundland" on 930 kHz].
| Coronal holes (1) | Coronal mass ejections (2) | M and X class flares (3) |
1) Effects from a coronal hole could reach Earth within the next 5 days. When the high speed stream has arrived
the color changes to green.
2) Material from a CME is likely to impact Earth within 96 hours.
3) There is a possibility of either M or X class flares within the next 48 hours.
Green: 0-20% probability, Yellow: 20-60% probability, Red: 60-100% probability.
Compare to the previous day's image.
Data for all numbered solar regions according to the Solar Region Summary provided by NOAA/SEC. Comments are my own, as is the STAR spot count (spots observed at or inside a few hours before midnight) and data for regions not numbered by SEC or where SEC has observed no spots. SEC active region numbers in the table below and in the active region map above are the historic SEC/USAF numbers.
| Active region | Date numbered | SEC spot count |
STAR spot count |
Location at midnight | Area | Classification | Comment |
|---|---|---|---|---|---|---|---|
| 10562 | 2004.02.19 | S12W48 | plage | ||||
| 10563 | 2004.02.20 | 2 | S23W39 | 0020 | CSO | spotless | |
| 10564 | 2004.02.21 | 28 | 32 | N15W54 | 0780 | EKC | beta-gamma-delta |
| 10565 | 2004.02.23 | 11 | 10 | S04W33 | 0180 | DAO | |
| 10566 | 2004.02.24 | N05W34 | plage | ||||
| 10567 | 2004.02.27 | 9 | 19 | S13E37 | 0070 | DAO |
classification was CAO at midnight |
| 10568 | 2004.02.28 | 4 | 1 | S16W20 | 0020 | BXO |
formerly region S365 classification was HRX at midnight |
| S366 | emerged on 2004.02.27 |
S09W45 | plage | ||||
| Total spot count: | 54 | 62 | |||||
| SSN: | 104 | 102 | |||||
| Month | Average solar flux at Earth |
International sunspot number | Smoothed sunspot number |
|---|---|---|---|
| 2000.04 | 184.2 | 125.5 | 120.8 cycle 23 sunspot max. |
| 2000.07 | 202.3 | 170.1 | 119.8 |
| 2001.12 | 235.1 | 132.2 | 114.6 (-0.9) |
| 2003.01 | 144.0 | 79.7 | 80.8 (-1.2) |
| 2003.02 | 124.5 | 46.0 | 78.3 (-2.5) |
| 2003.03 | 131.4 | 61.1 | 74.0 (-4.3) |
| 2003.04 | 126.4 | 60.0 | 70.1 (-3.9) |
| 2003.05 | 115.7 | 55.2 | 67.6 (-2.5) |
| 2003.06 | 129.3 | 77.4 | 65.0 (-2.6) |
| 2003.07 | 127.7 | 83.3 | 61.8 (-3.2) |
| 2003.08 | 122.1 | 72.7 | (59.4 predicted, -2.4) |
| 2003.09 | 112.2 | 48.7 | (57.6 predicted, -1.8) |
| 2003.10 | 151.7 | 65.5 | (54.9 predicted, -2.7) |
| 2003.11 | 140.8 | 67.3 | (52.2 predicted, -2.7) |
| 2003.12 | 114.9 | 46.5 | (49.6 predicted, -2.6) |
| 2004.01 | 114.1 | 37.2 | (45.4 predicted, -4.2) |
| 2004.02 | 106.9 (1) | 72.7 (2) | (40.8 predicted, -4.6) |
1) Running average based on the daily 20:00 UTC observed solar flux value at 2800 MHz.
2) Unofficial, accumulated value based on the Boulder (NOAA/SEC) sunspot number. The official international sunspot number is typically
30-50% less.
This report has been prepared by Jan Alvestad. It is based partly on my own observations and analysis, and partly on data from sources noted in solar links. All time references are to the UTC day. Comments and suggestions are always welcome.
| [DX-Listeners' Club] |