
Last major update issued on February 16, 2004 at 04:15 UTC.
[Solar and geomagnetic data - last month (updated daily)]
[Solar wind and electron fluence charts (updated daily)]
[Solar cycles 21-23 (last update February 2, 2004)]
[Solar cycles 1-20]
[Graphical comparison of cycles 21, 22 and 23 (last update February 2, 2004)]
[Graphical comparison of cycles 2, 10, 13, 17, 20 and 23 (last update February
2, 2004)]
[Historical solar and geomagnetic data charts 1954-2003 (last update January 16,
2004)]
[Archived reports (last update February 9, 2004)]
The geomagnetic field was quiet to minor storm on February 15 (the 21-00 h UTC quiet interval is based on partial data, may actually have been unsettled). Solar wind speed ranged between 627 and 967 km/sec under the influence of a high speed stream from coronal hole CH80.
Solar flux measured at 20h UTC on 2.8 GHz was 102.1. The planetary A
index was 18 (STAR Ap - based on the mean of three hour interval ap indices: 19.0).
Three hour interval K indices: 44353332 (planetary), 54442423 (Boulder).
The background x-ray flux is at the class B1 level.
At midnight there were 7 spotted regions on the visible disk. Solar flare activity was very low. No C class events was recorded during the day.
Region 10554 decayed slowly and is losing the trailing spots.
Region 10555 reemerged with a single spot.
Region 10558 was quiet and stable.
Region 10559 decayed and lost more than half of the penumbral area.
New region 10560 emerged in the southeast quadrant on February 14 and was numbered the next day by SEC. The region
developed slowly on February 15.
New region 10561 rotated into view at the northeast limb on February 14 and was numbered the next day by SEC.
Spotted regions not numbered by NOAA/SEC:
[S354] This region emerged in the northwest quadrant late on February 14 just west of spotless region 10556. The region
developed quickly initially, then decayed on February 15. location at midnight: N16W42. Please note that SEC has this as region
10556.
February 13-15: No partly or fully earth directed CMEs observed.
Coronal hole history (since late October 2002)
Compare today's report with the situation one solar rotation ago: 28
days ago 27 days ago 26 days ago
A recurrent trans equatorial coronal hole (CH80) was in a geoeffective position on February 9-13. There is a small coronal hole in the southeast quadrant.
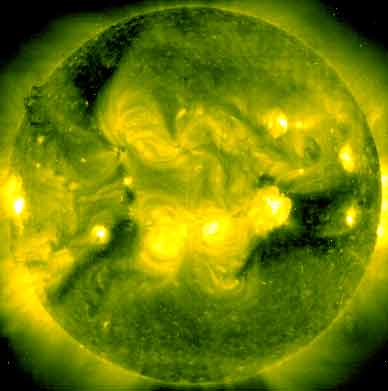
Processed SOHO/EIT 284 image at 19:06 UTC on February 15. The darkest areas on the solar disk are likely coronal holes.
The geomagnetic field is expected to be quiet to active on February 16 due to a high speed stream from coronal hole CH80. Quiet to unsettled is likely on February 17-20.
Long distance low and medium frequency (below 2 MHz) propagation along east-west paths over high and upper middle latitudes is poor. Propagation along long distance north-south paths is poor. [Trans Atlantic propagation conditions are currently monitored every night on 1470 kHz. Dominant stations tonight: Radio Vibraci�n (Venezuela) and Radio Cristal del Uruguay on the southwesterly longwire, WLAM Lewiston ME on the northwesterly EWE. A few other stations from the northeastern part of the US were audible with 1440, 1510, 1540 and 1590 kHz having the best signals].
| Coronal holes (1) | Coronal mass ejections (2) | M and X class flares (3) |
1) Effects from a coronal hole could reach Earth within the next 5 days. When the high speed stream has arrived
the color changes to green.
2) Material from a CME is likely to impact Earth within 96 hours.
3) There is a possibility of either M or X class flares within the next 48 hours.
Green: 0-20% probability, Yellow: 20-60% probability, Red: 60-100% probability.

Compare to the previous day's image.
Data for all numbered solar regions according to the Solar Region Summary provided by NOAA/SEC. Comments are my own, as is the STAR spot count (spots observed at or inside a few hours before midnight) and data for regions not numbered by SEC or where SEC has observed no spots. SEC active region numbers in the table below and in the active region map above are the historic SEC/USAF numbers.
| Active region | Date numbered | SEC spot count |
STAR spot count |
Location at midnight | Area | Classification | Comment |
|---|---|---|---|---|---|---|---|
| 10554 | 2004.02.07 | 6 | 4 | S09W28 | 0130 | CSO | |
| 10555 | 2004.02.09 | 1 | S15W08 | 0020 | HRX | ||
| 10556 | 2004.02.11 | 2 | N17W32 (SEC: N16W37) |
0020 | BXO |
spotless SEC has moved region 10556 to the position of region S354 |
|
| 10557 | 2004.02.13 | S11W58 | plage | ||||
| 10558 | 2004.02.13 | 1 | 1 | S16E07 | 0010 | AXX |
classification was HRX at midnight |
| 10559 | 2004.02.14 | 4 | 2 | N08W56 | 0060 | DSO |
classification was HAX at midnight, area 0030 |
| 10560 | 2004.02.15 | 1 | 8 | S16E30 | 0020 | AXX |
formerly region S355 classification was DRO at midnight, area 0020 |
| 10561 | 2004.02.15 | 1 | 1 | N02E64 | 0030 | HRX |
formerly region S356 classification was HSX at midnight, area 0040 |
| S354 | emerged on 2004.02.14 |
2 | N16W41 | 0020 | HAX | ||
| Total spot count: | 15 | 24 | |||||
| SSN: | 75 | 94 | |||||
| Month | Average solar flux at Earth |
International sunspot number | Smoothed sunspot number |
|---|---|---|---|
| 2000.04 | 184.2 | 125.5 | 120.8 cycle 23 sunspot max. |
| 2000.07 | 202.3 | 170.1 | 119.8 |
| 2001.12 | 235.1 | 132.2 | 114.6 (-0.9) |
| 2003.01 | 144.0 | 79.7 | 80.8 (-1.2) |
| 2003.02 | 124.5 | 46.0 | 78.3 (-2.5) |
| 2003.03 | 131.4 | 61.1 | 74.0 (-4.3) |
| 2003.04 | 126.4 | 60.0 | 70.1 (-3.9) |
| 2003.05 | 115.7 | 55.2 | 67.6 (-2.5) |
| 2003.06 | 129.3 | 77.4 | 65.0 (-2.6) |
| 2003.07 | 127.7 | 83.3 | 61.8 (-3.2) |
| 2003.08 | 122.1 | 72.7 | (59.4 predicted, -2.4) |
| 2003.09 | 112.2 | 48.7 | (57.6 predicted, -1.8) |
| 2003.10 | 151.7 | 65.6 | (54.9 predicted, -2.7) |
| 2003.11 | 140.8 | 67.2 | (52.2 predicted, -2.7) |
| 2003.12 | 114.9 | 47.0 | (49.6 predicted, -2.6) |
| 2004.01 | 114.1 | 37.2 | (45.4 predicted, -4.2) |
| 2004.02 | 107.6 (1) | 43.1 (2) | (40.8 predicted, -4.6) |
1) Running average based on the daily 20:00 UTC observed solar flux value at 2800 MHz.
2) Unofficial, accumulated value based on the Boulder (NOAA/SEC) sunspot number. The official international sunspot number is typically
30-50% less.
This report has been prepared by Jan Alvestad. It is based partly on my own observations and analysis, and partly on data from sources noted in solar links. All time references are to the UTC day. Comments and suggestions are always welcome.
| [DX-Listeners' Club] |