
Last major update issued on February 9, 2004 at 04:05 UTC.
[Solar and geomagnetic data - last month (updated daily)]
[Solar wind and electron fluence charts (updated daily)]
[Solar cycles 21-23 (last update February 2, 2004)]
[Solar cycles 1-20]
[Graphical comparison of cycles 21, 22 and 23 (last update February 2, 2004)]
[Graphical comparison of cycles 2, 10, 13, 17, 20 and 23 (last update February
2, 2004)]
[Historical solar and geomagnetic data charts 1954-2003 (last update January 16,
2004)]
[Archived reports (last update February 3, 2004)]
The geomagnetic field was quiet to unsettled on February 8. Solar wind speed ranged between 354 and 459 km/sec, gradually decreasing until 15h UTC, then increasing to 440 km/sec at 22h UTC before decreasing slowly again. As I write this solar wind speed is down to about 390 km/sec.
Solar flux measured at 20h UTC on 2.8 GHz was 116.2. The planetary A
index was 8 (STAR Ap - based on the mean of three hour interval ap indices: 8.4).
Three hour interval K indices: 11123323 (planetary), 12112213 (Boulder).
The background x-ray flux is at the class B3 level.
At midnight there were 4 spotted regions on the visible disk. Solar flare activity was moderate. A total of 6 C and 1 M class events was recorded during the day. Spotless region 10553 produced a C1.3 flare at 04:52 UTC.
Region 10549 decayed further and could become spotless late today or tomorrow.
Region 10551 decayed significantly losing spots and penumbral area. There is a weak magnetic delta structure in the
eastern part of the largest trailing penumbra. This is where the leading negative polarity field of an unnumbered small bipolar
region is bordering the trailing positive polarity field of region 10551. A minor M class flare is possible.
Region 10554 developed very quickly and has magnetic delta structures in both the leading and trailing penumbrae. M class
flares are likely and there is a possibility of a major flare. Flares: C1.0 at 03:45, C1.0 at
04:03, C1.4 at 04:20, C1.3 at 09:18, C2.0 at 16:01 and M1.2 at 20:51 UTC.
Spotted regions not numbered by NOAA/SEC:
[S348] This small region rotated into view at the southeast limb late on February 9. Location at midnight: S13E79.
February 6-8: No partly or fully earth directed CMEs observed.
Coronal hole history (since late October 2002)
Compare today's report with the situation one solar rotation ago: 28
days ago 27 days ago 26 days ago
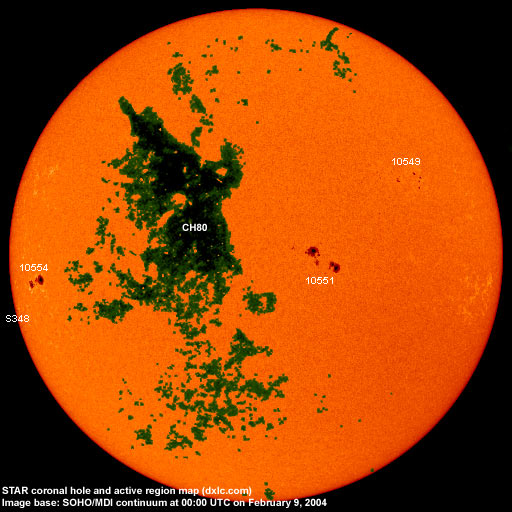
A recurrent trans equatorial coronal hole (CH80) will rotate into a geoeffective position on February 9-10.

Processed SOHO/EIT 284 image at 01:06 UTC on February 9. The darkest areas on the solar disk are likely coronal holes.
The geomagnetic field is expected to be quiet to unsettled February 9-11 and unsettled to active on February 12-13 due to a high speed stream from coronal hole CH80.
Long distance low frequency (below 2 MHz) propagation along east-west paths over high and upper middle latitudes is good. Propagation along long distance north-south paths is poor. [Trans Atlantic propagation conditions are currently monitored every night on 1470 kHz. Dominant station tonight: Radio Vibraci�n (Venezuela) on the northwesterly EWE, occasionally with interference from US stations. Lots of signals from the eastern parts of Canada and USA noted on other frequencies with the best signals in the lower part of the band. On 540 kHz CBT (Newfoundland) came through well at times, sometimes with interference from one of the French language CBC stations. 530 kHz had Radio Visi�n Cristiana with a clear signal. Propagation from Europe towards North America could improve further until February 12].
| Coronal holes (1) | Coronal mass ejections (2) | M and X class flares (3) |
1) Effects from a coronal hole could reach Earth within the next 5 days. When the high speed stream has arrived
the color changes to green.
2) Material from a CME is likely to impact Earth within 96 hours.
3) There is a possibility of either M or X class flares within the next 48 hours.
Green: 0-20% probability, Yellow: 20-60% probability, Red: 60-100% probability.
Compare to the previous day's image.
Data for all numbered solar regions according to the Solar Region Summary provided by NOAA/SEC. Comments are my own, as is the STAR spot count (spots observed at or inside a few hours before midnight) and data for regions not numbered by SEC or where SEC has observed no spots. SEC active region numbers in the table below and in the active region map above are the historic SEC/USAF numbers.
| Active region | Date numbered | SEC spot count |
STAR spot count |
Location at midnight | Area | Classification | Comment |
|---|---|---|---|---|---|---|---|
| 10546 | 2004.01.29 | S12W63 | plage | ||||
| 10548 | 2004.01.31 | N06W61 | plage | ||||
| 10549 | 2004.01.31 | 15 | 11 | N13W36 | 0080 | ESC |
classification was DSO at midnight, area 0040 |
| 10551 | 2004.02.02 | 23 | 27 | S06W14 | 0370 | EKO | beta-gamma-delta |
| 10552 | 2004.02.02 | S08W57 | plage | ||||
| 10553 | 2004.02.05 | S04W38 | plage | ||||
| 10554 | 2004.02.07 | 6 | 17 | S08E62 | 0170 | DKC |
beta-gamma-delta area was 0300 at midnight |
| S343 | emerged on 2004.01.31 |
N15W74 | plage | ||||
| S348 | visible on 2004.02.08 |
1 | S13E79 | 0010 | AXX | ||
| Total spot count: | 44 | 56 | |||||
| SSN: | 74 | 96 | |||||
| Month | Average solar flux at Earth |
International sunspot number | Smoothed sunspot number |
|---|---|---|---|
| 2000.04 | 184.2 | 125.5 | 120.8 cycle 23 sunspot max. |
| 2000.07 | 202.3 | 170.1 | 119.8 |
| 2001.12 | 235.1 | 132.2 | 114.6 (-0.9) |
| 2003.01 | 144.0 | 79.7 | 80.8 (-1.2) |
| 2003.02 | 124.5 | 46.0 | 78.3 (-2.5) |
| 2003.03 | 131.4 | 61.1 | 74.0 (-4.3) |
| 2003.04 | 126.4 | 60.0 | 70.1 (-3.9) |
| 2003.05 | 115.7 | 55.2 | 67.6 (-2.5) |
| 2003.06 | 129.3 | 77.4 | 65.0 (-2.6) |
| 2003.07 | 127.7 | 83.3 | 61.8 (-3.2) |
| 2003.08 | 122.1 | 72.7 | (59.4 predicted, -2.4) |
| 2003.09 | 112.2 | 48.7 | (57.6 predicted, -1.8) |
| 2003.10 | 151.7 | 65.6 | (54.9 predicted, -2.7) |
| 2003.11 | 140.8 | 67.2 | (52.2 predicted, -2.7) |
| 2003.12 | 114.9 | 47.0 | (49.6 predicted, -2.6) |
| 2004.01 | 114.1 | 37.2 | (45.4 predicted, -4.2) |
| 2004.02 | 104.9 (1) | 25.0 (2) | (40.8 predicted, -4.6) |
1) Running average based on the daily 20:00 UTC observed solar flux value at 2800 MHz.
2) Unofficial, accumulated value based on the Boulder (NOAA/SEC) sunspot number. The official international sunspot number is typically
30-50% less.
This report has been prepared by Jan Alvestad. It is based partly on my own observations and analysis, and partly on data from sources noted in solar links. All time references are to the UTC day. Comments and suggestions are always welcome.
| [DX-Listeners' Club] |