
Last major update issued on December 5, 2004 at 05:00 UTC. Minor update posted at 07:23 UTC.
[Solar and geomagnetic data - last month (updated daily)]
[Solar wind and electron fluence charts (updated daily)]
[Solar cycles 21-23 (last update December 3, 2004)]
[Solar cycles 1-20]
[Graphical comparison of cycles 21, 22 and 23 (last update December 3, 2004)]
[Graphical comparison of cycles 2, 10, 13, 17, 20 and 23 (last update December
3, 2004)]
[Historical solar and geomagnetic data charts 1954-2004 (last update November 8,
2004)]
[Archived reports (last update December 1, 2004)]
The geomagnetic field was inactive to very quiet on December 4. Solar wind speed ranged between 289 and 376 km/sec, gradually decreasing all day. A very weak solar wind shock was observed at ACE at 04:03 UTC on December 5, likely the arrival of the CME observed on December 1. Solar wind speed increased abruptly from 300 to 360 km/sec.
Solar flux measured at 20h UTC on 2.8 GHz was 97.4. The planetary A
index was 1 (STAR Ap - based on the mean of three hour interval ap indices: 1.1). This is the lowest daily Ap since the
last solar minimum.
Three hour interval K indices: 00000100 (planetary), 00002000 (Boulder).
The background x-ray flux is at the class B1 level.
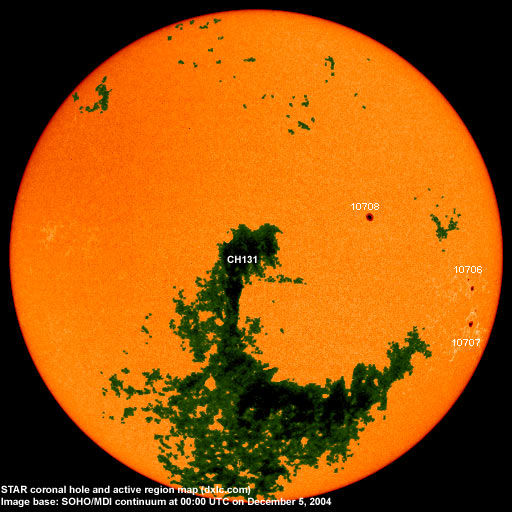
At midnight there were 3 spotted regions on the visible solar disk. The solar flare activity level was very low. No C class events were recorded during the day.
Region 10706 decayed slowly and quietly.Comment added at 07:23 UTC on December 5: A strong solar wind shock was observed at ACE at 06:56 UTC. The interplanetary magnetic field is currently strongly northwards. Should a significant southward swing occur we could se major geomagnetic storming. Solar wind speed has jumped from 350 to 450 km/sec.
December 2 and 4: No obviously Earth directed CMEs observed.
December 3: A full halo CME was observed in LASCO C3 images beginning at 00:42 UTC. This CME was fast and aimed
squarely at Earth. An impact is likely before 07 UTC on December 5.
Coronal hole history (since late October 2002)
Compare today's report with the situation one solar rotation ago: 28
days ago 27 days ago 26 days ago
Recurrent trans equatorial coronal hole CH131 will be in a geoeffective position on December 5.

Processed SOHO/EIT 284 image at 01:06 UTC on December 5. The darkest areas on the solar disk are likely coronal holes.
The geomagnetic field is expected to be quiet to active on December 5 with a chance of minor storm intervals due to a CME arrival. On December 6-7 quiet conditions are likely becoming unsettled to active on December 8-9 due to effects from coronal hole CH131.
| Coronal holes (1) | Coronal mass ejections (2) | M and X class flares (3) |
1) Effects from a coronal hole could reach Earth within the next 5 days. When the high speed stream has arrived
the color changes to green.
2) Material from a CME is likely to impact Earth within 96 hours.
3) There is a possibility of either M or X class flares within the next 48 hours.
Green: 0-20% probability, Yellow: 20-60% probability, Red: 60-100% probability.
Long distance low and medium frequency (below 2 MHz) propagation along east-west paths over high and upper middle latitudes is fair. Propagation along long distance north-south paths is poor. Trans Atlantic propagation conditions are normally monitored every night on 1470 kHz. Dominant stations tonight: Radio Vibraci�n (Venezuela) and WLAM Lewiston ME. Stations from North America had poor to fair signals on a number of frequencies throughout the band.
Compare to the previous day's image.
Data for all numbered solar regions according to the Solar Region Summary provided by NOAA/SEC. Comments are my own, as is the STAR spot count (spots observed at or inside a few hours before midnight) and data for regions not numbered by SEC or where SEC has observed no spots. SEC active region numbers in the table below and in the active region map above are the historic SEC/USAF numbers.
| Active region | Date numbered | SEC spot count |
STAR spot count |
Location at midnight | Area | Classification | Comment |
|---|---|---|---|---|---|---|---|
| 10706 | 2004.11.24 | 4 | 2 | S07W62 | 0080 | CAO |
classification was DSO at midnight, area 0040 |
| 10707 | 2004.11.24 | 3 | 3 | S13W64 | 0110 | DAO |
classification was CSO at midnight, area 0050 |
| 10708 | 2004.11.26 | 6 | 1 | N09W26 | 0090 | CAO |
classification was HSX at midnight, area 0080 |
| 10709 | 2004.12.03 | N06E48 | plage | ||||
| Total spot count: | 13 | 6 | |||||
| SSN: | 43 | 36 | |||||
| Month | Average solar flux at Earth |
International sunspot number | Smoothed sunspot number |
|---|---|---|---|
| 2000.04 | 184.2 | 125.5 | 120.8 cycle 23 sunspot max. |
| 2000.07 | 202.3 | 170.1 | 119.8 |
| 2001.12 | 235.1 | 132.2 | 114.6 (-0.9) |
| 2003.10 | 151.7 | 65.5 | 58.2 (-1.3) |
| 2003.11 | 140.8 | 67.3 | 56.7 (-1.5) |
| 2003.12 | 114.9 | 46.5 | 54.8 (-1.9) |
| 2004.01 | 114.1 | 37.3 | 52.0 (-2.8) |
| 2004.02 | 107.0 | 45.8 | 49.3 (-2.7) |
| 2004.03 | 112.0 | 49.1 | 47.1 (-2.2) |
| 2004.04 | 101.2 | 39.3 | 45.5 (-1.6) |
| 2004.05 | 99.8 | 41.5 | 43.9 (-1.6) |
| 2004.06 | 97.4 | 43.2 | (42.2 predicted, -1.7) |
| 2004.07 | 119.1 | 51.0 | (40.6 predicted, -1.6) |
| 2004.08 | 109.6 | 40.9 | (39.0 predicted, -1.6) |
| 2004.09 | 103.1 | 27.7 | (37.1 predicted, -1.9) |
| 2004.10 | 105.9 | 48.4 | (34.9 predicted, -2.2) |
| 2004.11 | 113.2 | 43.7 | (33.0 predicted, -1.9) |
| 2004.12 | 103.7 (1) | 7.1 (2) | (30.7 predicted, -2.3) |
1) Running average based on the daily 20:00 UTC observed solar flux value at 2800 MHz.
2) Unofficial, accumulated value based on the Boulder (NOAA/SEC) sunspot number. The official international sunspot number is typically
30-50% less.
This report has been prepared by Jan Alvestad. It is based partly on my own observations and analysis, and partly on data from some of these solar data sources. All time references are to the UTC day. Comments and suggestions are always welcome.
| [DX-Listeners' Club] |