
Last major update issued on April 25, 2004 at 03:20 UTC.
[Solar and geomagnetic data - last month (updated daily)]
[Solar wind and electron fluence charts (updated daily)]
[Solar cycles 21-23 (last update April 2, 2004)]
[Solar cycles 1-20]
[Graphical comparison of cycles 21, 22 and 23 (last update April 2, 2004)]
[Graphical comparison of cycles 2, 10, 13, 17, 20 and 23 (last update April 2, 2004)]
[Historical solar and geomagnetic data charts 1954-2003 (last update January 16,
2004)]
[Archived reports (last update April 18, 2004)]
The geomagnetic field was quiet to active on April 24. Solar wind speed ranged between 406 and 551 km/sec. A weak solar wind shock was observed at ACE at 08:07 UTC with a sudden increase in solar wind speed from 410 to 470 km/sec. A discontinuity in the solar wind was observed at 23:10 UTC when solar wind speed at ACE jumped from 450 to 540 km/sec. There was no associated sudden increase in solar wind density and the cause of this event is unknown.
Solar flux measured at 20h UTC on 2.8 GHz was 111.6. The planetary A
index was 11 (STAR Ap - based on the mean of three hour interval ap indices: 11.6).
Three hour interval K indices: 12343312 (planetary), 22333232 (Boulder).
The background x-ray flux is at the class B2 level.
At midnight there were 2 spotted regions on the visible disk. The solar flare activity level was low. A total of 13 C class events was recorded during the day. Region 10597 behind the southwest limb produced a number of flares: C1.6 at 00:11, C2.9 at 01:00, C2.9 at 02:08, C1.0 at 03:08, C1.2 at 04:16, C1.5 at 05:53, C1.2 at 06:57, C1.3 at 09:01, C1.0 at 13:01 and C1.2 at 14:03 UTC.
Region 10596 decayed slowly and quietly.
New region 10599 emerged very quickly early on April 24 in the northeast quadrant. The region has a magnetic delta
structure and could produce minor M class flares. Flares: C2.6 at 15:27, C1.4 at 15:34, C1.1
at 19:27
April 22-24: No fully or partly Earth directed CME observed due to no new LASCO images (SOHO is currently recovering from a failure).
Coronal hole history (since late October 2002)
Compare today's report with the situation one solar rotation ago: 28
days ago 27 days ago 26 days ago
A recurrent coronal hole (CH92) in the northern hemisphere was in a geoeffective position on April 23-25.

Processed SOHO/EIT 284 image at 01:05 UTC on April 22. The darkest areas on the solar disk are likely coronal holes.
The geomagnetic field is expected to be quiet to unsettled on most of April 25. Late on April 25 or early on April 26 a high speed stream from coronal hole CH92 is likely to arrive and cause unsettled to minor storm conditions until April 28.
Long distance low and medium frequency (below 2 MHz) propagation along east-west paths over high and upper middle latitudes is poor. Propagation along long distance north-south paths is poor to fair. [Trans Atlantic propagation conditions are currently monitored every night on 1470 kHz. Dominant station tonight: Radio Vibraci�n (Venezuela) with s fairly strong signal before 02:30, then CPN Radio (Per�) gradually became the dominant station. Some weak signals from the USA noted (1510, 1650, 1660 and 1700 kHz)].
| Coronal holes (1) | Coronal mass ejections (2) | M and X class flares (3) |
1) Effects from a coronal hole could reach Earth within the next 5 days. When the high speed stream has arrived
the color changes to green.
2) Material from a CME is likely to impact Earth within 96 hours.
3) There is a possibility of either M or X class flares within the next 48 hours.
Green: 0-20% probability, Yellow: 20-60% probability, Red: 60-100% probability.
Compare to the previous day's image.
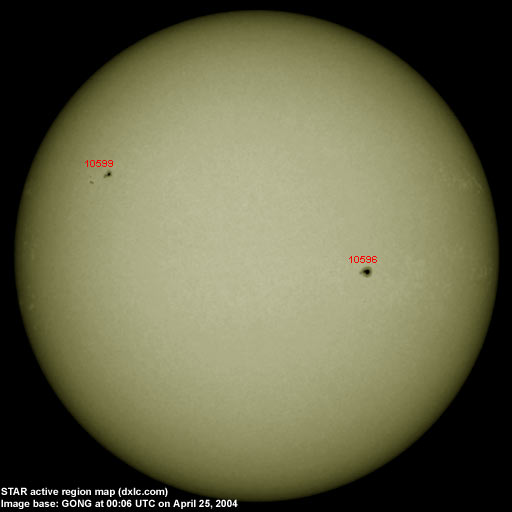
Data for all numbered solar regions according to the Solar Region Summary provided by NOAA/SEC. Comments are my own, as is the STAR spot count (spots observed at or inside a few hours before midnight) and data for regions not numbered by SEC or where SEC has observed no spots. SEC active region numbers in the table below and in the active region map above are the historic SEC/USAF numbers.
| Active region | Date numbered | SEC spot count |
STAR spot count |
Location at midnight | Area | Classification | Comment |
|---|---|---|---|---|---|---|---|
| 10592 | 2004.04.13 | S10W86 | plage | ||||
| 10594 | 2004.04.14 | N15W65 | plage | ||||
| 10595 | 2004.04.16 | 11 | S08W38 | 0010 | BXO |
spotless instead of numbering a new region, SEC has reused 10595. See S391 |
|
| 10596 | 2004.04.18 | 15 | 4 | S09W21 | 0240 | ESO |
classification was CAO at midnight |
| 10598 | 2004.04.21 | S07W71 | plage | ||||
| 10599 | 2004.04.24 | 8 | 17 | N14E51 | 0120 | DAI | beta-delta |
| S391 | emerged on 2004.04.16 |
S06W39 |
became spotless on April 24 |
||||
| S393 | emerged on 2004.04.18 |
N07W72 | plage | ||||
| Total spot count: | 34 | 21 | |||||
| SSN: | 64 | 41 | |||||
| Month | Average solar flux at Earth |
International sunspot number | Smoothed sunspot number |
|---|---|---|---|
| 2000.04 | 184.2 | 125.5 | 120.8 cycle 23 sunspot max. |
| 2000.07 | 202.3 | 170.1 | 119.8 |
| 2001.12 | 235.1 | 132.2 | 114.6 (-0.9) |
| 2003.03 | 131.4 | 61.1 | 74.0 (-4.3) |
| 2003.04 | 126.4 | 60.0 | 70.1 (-3.9) |
| 2003.05 | 115.7 | 55.2 | 67.6 (-2.5) |
| 2003.06 | 129.3 | 77.4 | 65.0 (-2.6) |
| 2003.07 | 127.7 | 83.3 | 61.8 (-3.2) |
| 2003.08 | 122.1 | 72.7 | 60.0 (-1.8) |
| 2003.09 | 112.2 | 48.7 | 59.5 (-0.5) |
| 2003.10 | 151.7 | 65.5 | (58.0 predicted, -1.5) |
| 2003.11 | 140.8 | 67.3 | (55.9 predicted, -2.1) |
| 2003.12 | 114.9 | 46.5 | (53.3 predicted, -2.6) |
| 2004.01 | 114.1 | 37.2 | (49.1 predicted, -4.2) |
| 2004.02 | 107.0 | 46.0 | (44.5 predicted, -4.6) |
| 2004.03 | 112.0 | 48.9 | (41.7 predicted, -2.8) |
| 2004.04 | 102.8 (1) | 51.8 (2) | (39.6 predicted, -2.1) |
1) Running average based on the daily 20:00 UTC observed solar flux value at 2800 MHz.
2) Unofficial, accumulated value based on the Boulder (NOAA/SEC) sunspot number. The official international sunspot number is typically
30-50% less.
This report has been prepared by Jan Alvestad. It is based partly on my own observations and analysis, and partly on data from some of these solar data sources. All time references are to the UTC day. Comments and suggestions are always welcome.
| [DX-Listeners' Club] |