
Last major update issued on April 9, 2004 at 05:05 UTC.
[Solar and geomagnetic data - last month (updated daily)]
[Solar wind and electron fluence charts (updated daily)]
[Solar cycles 21-23 (last update April 2, 2004)]
[Solar cycles 1-20]
[Graphical comparison of cycles 21, 22 and 23 (last update April 2, 2004)]
[Graphical comparison of cycles 2, 10, 13, 17, 20 and 23 (last update April 2, 2004)]
[Historical solar and geomagnetic data charts 1954-2003 (last update January 16,
2004)]
[Archived reports (last update April 5, 2004)]
The geomagnetic field was quiet to active on April 8. Solar wind speed ranged between 427 and 474 km/sec under the influence of a high speed stream from coronal hole CH88. A solar wind shock was observed at SOHO at 01:47 UTC on April 9. This was likely the arrival of a full halo CME observed on April 6.
Solar flux measured at 20h UTC on 2.8 GHz was 93.5. The planetary A
index was 16 (STAR Ap - based on the mean of three hour interval ap indices: 17.9).
Three hour interval K indices: 24443322 (planetary), 24452322 (Boulder).
The background x-ray flux is at the class A8 level.
At midnight there were 2 spotted regions on the visible disk. The solar flare activity level was low. A total of 3 C class events was recorded during the day. A C1.2 flare at 01:51 UTC had its origin just behind the northwest limb and was associated with a small CME.
Region 10588 was quiet and stable.
Spotted regions not numbered by NOAA/SEC:
[S380] This region emerged on April 3 just south of region 10588. The region developed
moderately quickly on April 4 and slowly on April 5. Slow decay was observed on April 6 after an M2 flare. Late on April 7 new
positive polarity flux emerged and a magnetic delta structure formed. Quick decay was observed on April 8 after a long duration C
class event. Location at midnight: S17W14. Flares: C7.4 long duration event peaking at 10:19
and C1.3 at 13:20 UTC. The C7 event was associated with a full halo CME.
April 6: A full halo CME was observed in LASCO images after an M2.4 event in region S380 peaking at 13:28 UTC. This CME is
likely to reach Earth near noon on April 8.
April 7: No fully or partly Earth directed CME observed.
April 8: A full halo CME was observed after a long duration C7 event in region S380. This CME will likely reach Earth late
on April 10 and cause unsettled to minor storm conditions.
Coronal hole history (since late October 2002)
Compare today's report with the situation one solar rotation ago: 28
days ago 27 days ago 26 days ago
An elongated, recurrent trans equatorial coronal hole (CH88) was in a geoeffective position on April 1-7. This coronal hole is best defined in the easternmost part, however, the overall size of the coronal hole is much smaller than one rotation ago.
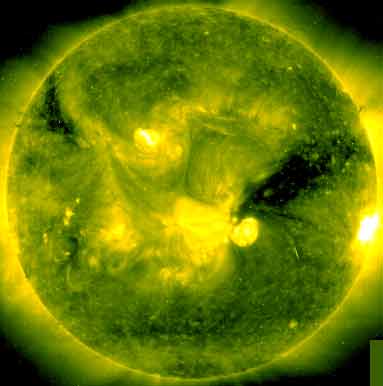
Processed SOHO/EIT 284 image at 01:06 UTC on April 9. The darkest areas on the solar disk are likely coronal holes.
The geomagnetic field is expected to be unsettled to active on April 9, quiet to active on April 10 and quiet to minor storm on April 11.
Long distance low and medium frequency (below 2 MHz) propagation along east-west paths over high and upper middle latitudes is very poor. Propagation along long distance north-south paths is poor to fair. [Trans Atlantic propagation conditions are currently monitored every night on 1470 kHz. Dominant station tonight: Radio Vibraci�n (with Union Radio Noticias programming). On one of my antennas CPN Radio (Per�) had a weak signal. WWZN 1510 was there as usual, its signal was rather weak].
| Coronal holes (1) | Coronal mass ejections (2) | M and X class flares (3) |
1) Effects from a coronal hole could reach Earth within the next 5 days. When the high speed stream has arrived
the color changes to green.
2) Material from a CME is likely to impact Earth within 96 hours.
3) There is a possibility of either M or X class flares within the next 48 hours.
Green: 0-20% probability, Yellow: 20-60% probability, Red: 60-100% probability.
Compare to the previous day's image.
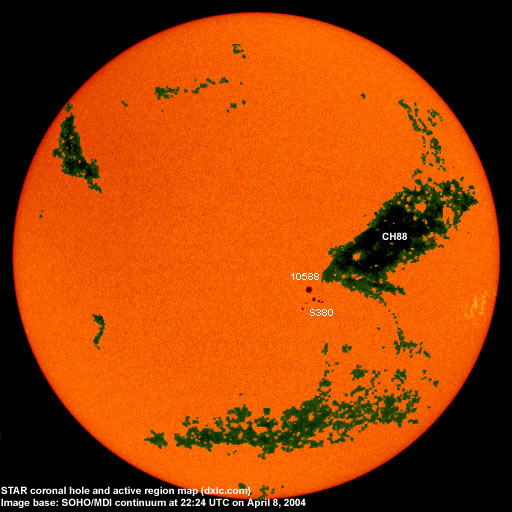
Data for all numbered solar regions according to the Solar Region Summary provided by NOAA/SEC. Comments are my own, as is the STAR spot count (spots observed at or inside a few hours before midnight) and data for regions not numbered by SEC or where SEC has observed no spots. SEC active region numbers in the table below and in the active region map above are the historic SEC/USAF numbers.
| Active region | Date numbered | SEC spot count |
STAR spot count |
Location at midnight | Area | Classification | Comment |
|---|---|---|---|---|---|---|---|
| 10587 | 2004.03.28 | 2 | S13W72 | 0020 | AXX | spotless | |
| 10588 | 2004.04.01 | 11 | 1 | S13W13 (SEC: S16W13) |
0140 | DAO |
SEC spot count, area and classification include region S380 classification was HSX at midnight, area 0070 |
| 10589 | 2004.04.05 | N11E16 | plage | ||||
| 10590 | 2004.04.07 | S09W84 | plage | ||||
| S380 | emerged on 2004.04.03 |
8 | S17W14 | 0060 | DSO | reversed polarity | |
| S383 | emerged on 2004.04.05 |
S19W07 | plage | ||||
| Total spot count: | 13 | 9 | |||||
| SSN: | 33 | 29 | |||||
| Month | Average solar flux at Earth |
International sunspot number | Smoothed sunspot number |
|---|---|---|---|
| 2000.04 | 184.2 | 125.5 | 120.8 cycle 23 sunspot max. |
| 2000.07 | 202.3 | 170.1 | 119.8 |
| 2001.12 | 235.1 | 132.2 | 114.6 (-0.9) |
| 2003.03 | 131.4 | 61.1 | 74.0 (-4.3) |
| 2003.04 | 126.4 | 60.0 | 70.1 (-3.9) |
| 2003.05 | 115.7 | 55.2 | 67.6 (-2.5) |
| 2003.06 | 129.3 | 77.4 | 65.0 (-2.6) |
| 2003.07 | 127.7 | 83.3 | 61.8 (-3.2) |
| 2003.08 | 122.1 | 72.7 | 60.0 (-1.8) |
| 2003.09 | 112.2 | 48.7 | 59.5 (-0.5) |
| 2003.10 | 151.7 | 65.5 | (58.0 predicted, -1.5) |
| 2003.11 | 140.8 | 67.3 | (55.9 predicted, -2.1) |
| 2003.12 | 114.9 | 46.5 | (53.3 predicted, -2.6) |
| 2004.01 | 114.1 | 37.2 | (49.1 predicted, -4.2) |
| 2004.02 | 107.0 | 46.0 | (44.5 predicted, -4.6) |
| 2004.03 | 112.0 | 48.9 | (41.7 predicted, -2.8) |
| 2004.04 | 104.9 (1) | 19.2 (2) | (39.6 predicted, -2.1) |
1) Running average based on the daily 20:00 UTC observed solar flux value at 2800 MHz.
2) Unofficial, accumulated value based on the Boulder (NOAA/SEC) sunspot number. The official international sunspot number is typically
30-50% less.
This report has been prepared by Jan Alvestad. It is based partly on my own observations and analysis, and partly on data from some of these solar data sources. All time references are to the UTC day. Comments and suggestions are always welcome.
| [DX-Listeners' Club] |