
Last update issued on September 2, 2003 at 03:30 UTC.
[Solar and geomagnetic data - last month (updated daily)]
[Solar wind and electron fluence charts (updated daily)]
[Solar cycles 21-23 (last update September 1, 2003)]
[Solar cycles 1-20]
[Graphical comparison of cycles 21, 22 and 23 (last update September 1, 2003)]
[Graphical comparison of cycles 2, 10, 13, 17, 20 and 23 (last update September
1, 2003)]
[Historical solar and geomagnetic data charts 1954-2003 (last update July 23, 2003)]
[Archived reports (last update August 28, 2003)]
The geomagnetic field was quiet to active on September 1. Solar wind speed ranged between 361 and 582 km/sec. The first part of the disturbance associated with a high speed stream from coronal hole CH54 arrived at ACE just before 04h UTC. Initially the interplanetary magnetic field was moderate southwards, then mostly northwards between 07 and 16h UTC. After 16h UTC a fairly weak coronal hole stream dominated the solar wind.
Solar flux measured at 20h UTC on 2.8 GHz was 108.1. The planetary A
index was 14 (STAR Ap - based on the mean of three hour interval ap indices: 16.1).
Three hour interval K indices: 24412333 (planetary), 24422323 (Boulder).
The background x-ray flux is at the class B2 level.
At midnight there were 5 spotted regions on the visible disk. Solar flare activity was very low.
Region 10442 was mostly unchanged and quiet as it approached the southwest limb.
Region 10444 became spotless early in the day, then began to develop again during the afternoon and evening,
Region 10448 decayed losing most of its penumbral area. The region could become spotless today or tomorrow.
Region 10449 was quiet. A few additional trailing spots emerged.
Spotted regions not numbered by NOAA/SEC:
[S247] A new region emerged on August 31 in the southwest quadrant and was mostly unchanged on September 1. Location at midnight:
S08W39.
August 30 - September 1: No potentially geoeffective CMEs observed.
Coronal hole history (since late October 2002)
Compare today's report with the situation one solar rotation ago: 28
days ago 27 days ago
26 days ago
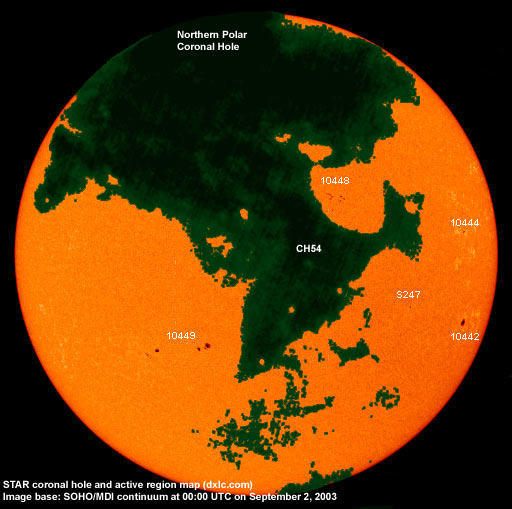
A large recurrent coronal hole (CH54) in the northern hemisphere and with a trans equatorial extension, will rotate into a geoeffective position on August 29- September 3.

Processed GOES SXI coronal structure image at 23:57 UTC on September 1. Base SXI image courtesy of NOAA/SEC. The darkest areas on the solar disk are likely coronal holes.
The geomagnetic field is expected to be unsettled to minor storm until September 6 under the influence of a high speed stream from coronal hole CH54.
Long distance low frequency (below 2 MHz) propagation along east-west paths over high and upper middle latitudes is very poor. Propagation along north-south paths is poor to fair. [Trans Atlantic propagation conditions are currently monitored every night on 1470 kHz. Dominant stations tonight: Radio Cristal del Uruguay. One or two signals from stations in Brazil were picked up as well].
| Coronal holes (1) | Coronal mass ejections (2) | M and X class flares (3) |
1) Effects from a coronal hole could reach Earth within the next 5 days.
2) Material from a CME is likely to impact Earth within 96 hours.
3) There is a possibility of either M or X class flares within the next 48 hours.
Green: 0-20% probability, Yellow: 20-60% probability, Red: 60-100% probability.
Compare to the previous day's image.
Data for all numbered solar regions according to the Solar Region Summary provided by NOAA/SEC. Comments are my own, as is the STAR spot count (spots observed at or inside a few hours before midnight) and data for regions not numbered by SEC or where SEC has observed no spots.
| Solar region | Date numbered | SEC spot count |
STAR spot count |
Location at midnight | Area | Classification | Comment |
|---|---|---|---|---|---|---|---|
| 10442 | 2003.08.22 | 4 | 5 | S13W61 | 0080 | CSO | |
| 10444 | 2003.08.25 | 2 | N08W60 | 0020 | HSX | ||
| 10445 | 2003.08.25 | N03W58 | plage | ||||
| 10446 | 2003.08.27 | S23W29 | plage | ||||
| 10447 | 2003.08.28 | N14W63 | plage | ||||
| 10448 | 2003.08.28 | 10 | 13 | N20W20 | 0040 | DAO |
classification was DRO at midnight, area 0030 |
| 10449 | 2003.08.28 | 4 | 14 | S17E20 (SEC: S16E13) |
0080 | DSO |
merged with 10450 classification was FAO at midnight, area 0120 |
| 10450 | 2003.08.29 | 1 | S17E27 | 0020 | HSX |
see comment for region 10449 |
|
| 10452 | 2003.08.29 | S06W31 | plage | ||||
| S245 | emerged on 2003.08.29 |
N23W74 | plage | ||||
| S246 | emerged on 2003.08.29 |
N10W44 | plage | ||||
| S247 | emerged on 2003.08.31 |
4 | S08W39 | 0010 | BXO | ||
| S248 | emerged on 2003.08.31 |
S23W48 | plage | ||||
| Total spot count: | 19 | 38 | |||||
| SSN: | 59 | 88 | |||||
| Month | Average solar flux at Earth |
International sunspot number | Smoothed sunspot number |
|---|---|---|---|
| 2000.04 | 184.2 | 125.5 | 120.8 cycle 23 sunspot max. |
| 2000.07 | 202.3 | 170.1 | 119.8 |
| 2001.12 | 235.1 | 132.2 | 114.6 (-0.9) |
| 2002.07 | 173.5 | 99.6 | 102.7 (-3.5) |
| 2002.08 | 183.6 | 116.4 | 98.7 (-4.0) |
| 2002.09 | 175.8 | 109.6 | 94.6 (-4.1) |
| 2002.10 | 167.0 | 97.5 | 90.5 (-4.1) |
| 2002.11 | 168.7 | 95.5 | 85.2 (-5.3) |
| 2002.12 | 157.2 | 80.8 | 82.0 (-3.2) |
| 2003.01 | 144.0 | 79.7 | 81.0 (-1.0) |
| 2003.02 | 124.5 | 46.0 | 78.5 (-2.5) |
| 2003.03 | 131.4 | 61.1 | (74.2 predicted, -4.3) |
| 2003.04 | 126.4 | 60.0 | (69.3 predicted, -4.9) |
| 2003.05 | 115.7 | 55.2 | (64.4 predicted, -4.9) |
| 2003.06 | 129.3 | 77.4 | (60.4 predicted, -4.0) |
| 2003.07 | 127.7 | 85.0 | (56.9 predicted, -3.5) |
| 2003.08 | 122.1 | 72.7 | (53.9 predicted, -3.0) |
| 2003.09 | 108.1 (1) | 2.0 (2) | (51.9 predicted, -2.0) |
1) Running average based on the daily 20:00 UTC observed solar flux value at 2800 MHz.
2) Unofficial, accumulated value based on the Boulder (NOAA/SEC) sunspot number. The official international sunspot number is typically
30-50% less.
This report has been prepared by Jan Alvestad. It is based partly on my own observations and analysis, and partly on data from sources noted in solar links. All time references are to the UTC day. Comments and suggestions are always welcome.
| [DX-Listeners' Club] |