
Last update issued on October 28, 2003 at 05:10 UTC. Minor update posted at 17.58 UTC. A very powerful solar storm will hit the Earth on October 29.
[Solar and geomagnetic data - last month (updated daily)]
[Solar wind and electron fluence charts (updated daily)]
[Solar cycles 21-23 (last update October 4, 2003)]
[Solar cycles 1-20]
[Graphical comparison of cycles 21, 22 and 23 (last update October 4, 2003)]
[Graphical comparison of cycles 2, 10, 13, 17, 20 and 23 (last update October
4, 2003)]
[Historical solar and geomagnetic data charts 1954-2003 (last update October 15, 2003)]
[Archived reports (last update October 22, 2003)]
The geomagnetic field was quiet to active on October 27. A few magnetometers recorded minor storm levels 06-07h UTC. Solar wind speed ranged between 438 and 560 km/sec. On October 28 at approximately 01:30 UTC a solar wind shock was observed at ACE. Solar wind speed has since increased to above 700 km/sec, however, the interplanetary magnetic field has been mostly northwards after the shock. This has been the case with all shocks related to CMEs with an origin in region 10486 and it remains to be seen if there will be a southwards swing before the next shock arrives.
Solar flux measured at 20h UTC on 2.8 GHz was 257.2. The planetary A
index was 15 (STAR Ap - based on the mean of three hour interval ap indices: 15.3).
Three hour interval K indices: 33432331 (planetary), 44433421 (Boulder).
The background x-ray flux is at the class C2-C3 level.
At midnight there were 9 spotted regions on the visible disk. Solar flare activity was high. A total of 10 C and 5 M class events was recorded during the day.
Region 10484 decayed losing a fair amount of penumbral area. The region is still complex, particularly in the leading
spot section where there is very little separation between opposite polarity umbrae. Major flares are possible. Flares:
M1.2 long duration event peaking at 04:39, M2.7/2F long duration event (with associated moderate type II and IV radio sweeps)
peaking at 08:33, C9.0/1N at 19:57 UTC.
Region 10486 developed slowly as the enormous main penumbra expanded. Major flares are likely. Flares: C6.2
at 01:38, C9.0 at 06:18, M5.0 at 09:27, M6.7 at 12:43, C7.5 at 18:45 and C6.8 at 23:52 UTC.
Region 10487 was mostly quiet and unchanged.
New region 10488 emerged in the northeast quadrant on October 26 and was numbered by SEC the next day. This region has
probably been the fastest developing region during solar cycle 23 and could soon surpass region 10484 in size. The leading umbra
is the largest on the visible disk. The amazing development has created two magnetic delta structures, a moderately strong one in
the southwest and a small one in the north. Most of the spots are in the same ring formed penumbra. A major flare is possible. Flares:
C5.1 at 14:11, C5.7 at 14:57, M1.9 at 21:51 and C4.1 at 23:17 UTC
New region 10489 emerged in the southeast quadrant on October 25 and was numbered by SEC two days later.
New region 10490 emerged in the southeast quadrant on October 25 and was numbered by SEC two days later. The region is
located just northeast of region 10486.
New region 10491 emerged in the southeast quadrant on October 27 and has developed moderately quickly.
New region 10492 emerged in the southwest quadrant on October 26 and was numbered by SEC the next day.
Spotted regions not numbered by NOAA/SEC:
[S292] A new region emerged in the northeast quadrant on October 27 due east of region 10488. Location at midnight: N08E16.
Comment added at 11:15 UTC on October 28: Region 10486 was the source of a major M8.4 long duration event peaking at 10:48 UTC. This event occurred
in the eastern part of the region and may have triggered a super flare in the remainder of the region, this flare peaked at 11:10 UTC. This
super flare has so far
peaked at the class X18 level which makes it the second largest flare during cycle 23. The event is likely to be associated with an enormous earth directed CME.
The CME will likely reach the Earth sometime between 8 and 17 UTC on October 29. This will be a direct hit and extremely severe geomagnetic storming is
possible. See flare image below:

Comment added at 11:40 UTC: The X18 flare has sent a very large solar storm towards the Earth. The speed of this storm is exceptional, probably
several thousand km/sec judging from the expansion in LASCO C2 images (see below). This flare is also a proton flare.

Comment added at 13:05 UTC: The X18+ flare in region 10486 had an amazing effect on most of the visible solar disk. It triggered large filament eruptions to the west northwest and east and caused a disintegration of the polar crown filament in the southwest quadrant. Some of the effects can be noted in this Solar Soft movie. Notice that the focus is off target, the focus is at the major M8 event in the eastern part of the region. The X18 flare was centered further west.
Proton levels at Earth are increasing quickly and this could become a major proton event.
Comment added at 17:58 UTC: A major proton storm is still in progress. The above 100 MeV proton flux, has peaked at the 180 pfu level, the above 50 MeV flux at the 1000 pfu level, while the above 10 MeV flux has reached the 5200 pfu level. Flux levels could increase further when the solar storm impacts the Earth tomorrow.
The speed of the solar storm heading towards the Earth is at least 2100 km/sec according to recent estimates.
October 27: There appears to have been at least one full halo CME during the day but I will need more time to properly analyze the events.
October 26: A full halo CME was observed after the X1.2 long duration event (peak at 06:54 UTC) in region 10486. This CME will reach Earth sometime between late on October 27 and noon on October 28.
Another full halo CME was associated with the X1 proton flare (peak at 18:19 UTC) in region 10484. This CME could arrive after noon on October 28.
October 25: No obviously geoeffective CMEs observed.
Coronal hole history (since late October 2002)
Compare today's report with the situation one solar rotation ago: 28
days ago 27 days ago 26 days ago
A recurrent coronal hole in the northern hemisphere (CH64) may have been in a geoeffective position on October 25-26. During the previous solar rotation this coronal hole did not cause a geomagnetic disturbance.
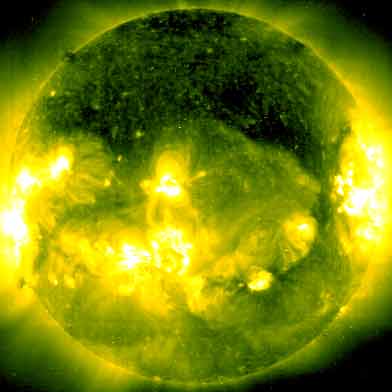
Processed SOHO/EIT 284 image at 01:06 UTC on October 28. The darkest areas on the solar disk are likely coronal holes.
The geomagnetic field is expected to be unsettled to minor storm on October 28-29 due to effects from CMEs impacting the Earth.
Long distance low frequency (below 2 MHz) propagation along east-west paths over high and upper middle latitudes is very poor. Propagation along north-south paths is poor. [Trans Atlantic propagation conditions are currently monitored every night on 1470 kHz. Dominant stations tonight: Radio Vibraci�n and Radio Cristal del Uruguay].
| Coronal holes (1) | Coronal mass ejections (2) | M and X class flares (3) |
1) Effects from a coronal hole could reach Earth within the next 5 days.
2) Material from a CME is likely to impact Earth within 96 hours.
3) There is a possibility of either M or X class flares within the next 48 hours.
Green: 0-20% probability, Yellow: 20-60% probability, Red: 60-100% probability.

Compare to the previous day's image.
Data for all numbered solar regions according to the Solar Region Summary provided by NOAA/SEC. Comments are my own, as is the STAR spot count (spots observed at or inside a few hours before midnight) and data for regions not numbered by SEC or where SEC has observed no spots.
| Solar region | Date numbered | SEC spot count |
STAR spot count |
Location at midnight | Area | Classification | Comment |
|---|---|---|---|---|---|---|---|
| 10482 | 2003.10.17 | N17W70 | plage | ||||
| 10483 | 2003.10.17 | S10W65 | plage | ||||
| 10484 | 2003.10.17 | 29 | 28 | N03W54 | 1440 | DKC | gamma-delta |
| 10485 | 2003.10.21 | S07W31 | plage | ||||
| 10486 | 2003.10.22 | 74 | 82 | S16E18 | 2180 | FKC |
gamma-delta area was 2500 at midnight |
| 10487 | 2003.10.25 | 13 | 12 | N14E46 | 0240 | DAO | |
| 10488 | 2003.10.27 | 20 | 47 | N09E09 | 0270 | DKO |
beta-gamma-delta formerly region S290 classification was DKC at midnight, area 1000 |
| 10489 | 2003.10.27 | 8 | 13 | S11E05 | 0030 | CRO |
formerly region S288 classification was DSO at midnight, area 0040 |
| 10490 | 2003.10.27 | 6 | 5 | S10E25 | 0050 | CSO |
formerly region S286 classification was DAO at midnight |
| 10491 | 2003.10.27 | 3 | 5 | S06E09 | 0050 | DAO | |
| 10492 | 2003.10.27 | 5 | 11 | S22W20 | 0010 | BXO |
formerly region S289 classification was DAO at midnight, area 0100 |
| S285 | emerged on 2003.10.23 |
N04W74 | plage | ||||
| S292 | emerged on 2003.10.27 |
3 | N08E16 | 0020 | DRO | ||
| Total spot count: | 158 | 206 | |||||
| SSN: | 238 | 296 | |||||
| Month | Average solar flux at Earth |
International sunspot number | Smoothed sunspot number |
|---|---|---|---|
| 2000.04 | 184.2 | 125.5 | 120.8 cycle 23 sunspot max. |
| 2000.07 | 202.3 | 170.1 | 119.8 |
| 2001.12 | 235.1 | 132.2 | 114.6 (-0.9) |
| 2002.09 | 175.8 | 109.6 | 94.6 (-4.1) |
| 2002.10 | 167.0 | 97.5 | 90.5 (-4.1) |
| 2002.11 | 168.7 | 95.5 | 85.2 (-5.3) |
| 2002.12 | 157.2 | 80.8 | 82.0 (-3.2) |
| 2003.01 | 144.0 | 79.7 | 80.9 (-1.1) |
| 2003.02 | 124.5 | 46.0 | 78.5 (-2.4) |
| 2003.03 | 131.4 | 61.1 | 74.1 (-4.4) |
| 2003.04 | 126.4 | 60.0 | (69.6 predicted, -4.5) |
| 2003.05 | 115.7 | 55.2 | (65.3 predicted, -4.3) |
| 2003.06 | 129.3 | 77.4 | (61.5 predicted, -3.8) |
| 2003.07 | 127.7 | 85.0 | (58.0 predicted, -3.5) |
| 2003.08 | 122.1 | 72.7 | (55.0 predicted, -3.0) |
| 2003.09 | 112.2 | 48.8 | (53.0 predicted, -2.0) |
| 2003.10 | 133.9 (1) | 83.2 (2) | (50.3 predicted, -2.7) |
1) Running average based on the daily 20:00 UTC observed solar flux value at 2800 MHz.
2) Unofficial, accumulated value based on the Boulder (NOAA/SEC) sunspot number. The official international sunspot number is typically
30-50% less.
This report has been prepared by Jan Alvestad. It is based partly on my own observations and analysis, and partly on data from sources noted in solar links. All time references are to the UTC day. Comments and suggestions are always welcome.
| [DX-Listeners' Club] |