
Last update issued on October 23, 2003 at 04:40 UTC. Last minor update posted at 14:59 UTC.
[Solar and geomagnetic data - last month (updated daily)]
[Solar wind and electron fluence charts (updated daily)]
[Solar cycles 21-23 (last update October 4, 2003)]
[Solar cycles 1-20]
[Graphical comparison of cycles 21, 22 and 23 (last update October 4, 2003)]
[Graphical comparison of cycles 2, 10, 13, 17, 20 and 23 (last update October
4, 2003)]
[Historical solar and geomagnetic data charts 1954-2003 (last update October 15, 2003)]
[Archived reports (last update October 22, 2003)]
The geomagnetic field was quiet to major storm on October 22. Solar wind speed ranged between 467 and 773 km/sec. The effects from a halo CME observed on October 19 dominated the solar wind all day, perhaps with the exception of the first few hours when some influence from a high speed stream from coronal hole CH63 may still have been present. The interplanetary magnetic field has been northwards since 18h UTC and the geomagnetic field has consequently become quiet.
Solar flux measured at 17h UTC on 2.8 GHz was 153.5 (the 20h UTC value was enhanced by an M9 flare). The planetary A
index was 33 (STAR Ap - based on the mean of three hour interval ap indices: 33.3).
Three hour interval K indices: 45654432 (planetary), 45544432 (Boulder).
The background x-ray flux is at the class C4 level.
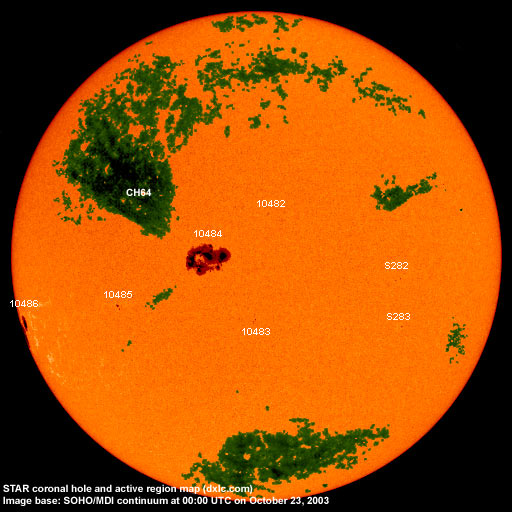
At midnight there were 7 spotted regions on the visible disk. Solar flare activity was high. A total of 3 C and 8 M class flares was recorded during the day.
Region 10482 decayed and had only a single tiny spot left at midnight. The region will likely become spotless today.
Region 10483 decayed and had only a couple of tiny spots left by the end of the day.
Region 10484 developed further in the eastern part while slow decay was observed in the southwest section. Recently
positive polarity flux has been emerging just north of the largest negative polarity umbra in the northern central part. The
region has several magnetic delta structures and could produce a major proton flare anytime. Flares:
M1.0 at 02:27, M1.4 at 15:11, M1.2 at 16:01, C5.5 at 17:03, C5.8 at 18:22 and M2.1 at 22:04 UTC.
Region 10485 decayed in the leading spot section while slow development occurred in the trailing spots.
New region 10486 rotated partly into view at the southeast limb. A huge penumbra (spanning at least 5 degrees latitude) is
at the limb southeast of the penumbra which first became visible. This region has been very active over the last days and could
produce X class flares. Flares: M3.7 long duration event peaking at 03:51 (and associated with
a CME off of the southeast limb), M1.7 at 08:44, M1.7 at 09:56 and a major M9.9 flare at 20:07 UTC.
Spotted regions not numbered by NOAA/SEC:
[S282] A new region emerged in the southwest quadrant near the equator on October 22. The region appeared to be
decaying slowly late in the day. Location at midnight: S02W35.
[S283] A new region emerged in the southwest quadrant on October 22. Location at midnight: S13W36.
The background proton flux have become slightly enhanced since 16h UTC on October 22.
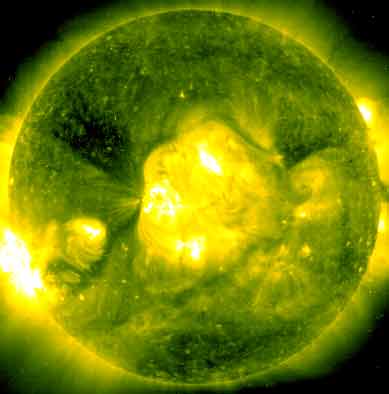
Comment added at 08:51 UTC on October 23: Region 10486 produced a major X5.4 flare at 08:35 UTC, see LASCO EIT image below. This flare is likely to have cause a large CME, but it is too early to tell how large and if it could become geoeffective. When LASCO C2 and C3 images covering the next few hours are available, I will post another update.
Comment added at 10:23 UTC: The X5 flare in region 10486 was associated with a huge CME observed off of the east limb in LASCO images. Fortunately the CME does not appear to have any significant geoeffective extensions (see C3 image below at 10:20 UTC where the sun is hidden in the center, the core of the CME is in red while other parts of the CME are in blue). Region 10486 itself has rotated better into view and has revealed a strong magnetic delta structure in the enormous main penumbra.

Comment added at 14:59 UTC: LASCO C3 images since my last update has displayed a full halo CME following the X5. The CME is weak in the west and well defined in the east. Earth could receive an impact on October 25.
October 22: A CME was observed off of the southeast limb following a long duration M3 event in region 10486. This CME is not likely to become geoeffective. A partial halo CME was observed in LASCO C3 images beginning at 10:20 UTC. Ejected material was first observed over the north pole and the northwest limb then below the south pole and the southwest limb at 10:42 UTC. By 12:42 UTC the CME had expanded to cover the entire west limb and high latitude parts of the northeast and southeast limbs. The distribution of the ejected material and the lack of frontside activity in the northwest quadrant suggests a source about 6 days behind the northwest limb. Other observers point to possible frontside sources in an erupting filament (mainly in the southeast quadrant) and an erupting loop system in the northern hemisphere. The major M9.9 flare in region 10486 at 20:07 was associated with a fast full halo CME. Most of the ejected material was observed over the southeast limb, the CME was faint over the west limb.
October 21: A large full halo CME was observed beginning at 03:54 UTC at the southeast limb. The source of this CME is a region one or two days behind the southeast limb. Further CMEs were observed late in the day from two sources at and just behind the southeast limb.
October 20: No potentially geoeffective CMEs observed.
Coronal hole history (since late October 2002)
Compare today's report with the situation one solar rotation ago: 28
days ago 27 days ago 26 days ago
A recurrent coronal hole in the northern hemisphere (CH64) could rotate into a geoeffective position on October 25. During the previous solar rotation this coronal hole did not cause a geomagnetic disturbance.
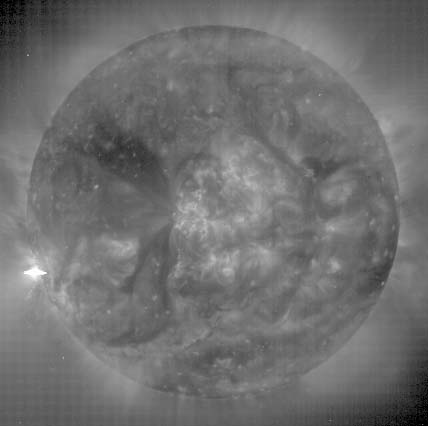
Processed SOHO/EIT 284 image at 01:06 UTC on October 23. The darkest areas on the solar disk are likely coronal holes.
The geomagnetic field is expected to be quiet to active on October 23 and the first half of October 24. During the latter half of October 24 a CME associated with an M9.9 flare in region 10486 could reach Earth and cause active to major geomagnetic storm conditions.
Long distance low frequency (below 2 MHz) propagation along east-west paths over high and upper middle latitudes is useless. Propagation along north-south paths is poor to very poor. [Trans Atlantic propagation conditions are currently monitored every night on 1470 kHz. Dominant station tonight: Radio Cristal del Uruguay with a weak signal].
| Coronal holes (1) | Coronal mass ejections (2) | M and X class flares (3) |
1) Effects from a coronal hole could reach Earth within the next 5 days.
2) Material from a CME is likely to impact Earth within 96 hours.
3) There is a possibility of either M or X class flares within the next 48 hours.
Green: 0-20% probability, Yellow: 20-60% probability, Red: 60-100% probability.
Compare to the previous day's image.
Data for all numbered solar regions according to the Solar Region Summary provided by NOAA/SEC. Comments are my own, as is the STAR spot count (spots observed at or inside a few hours before midnight) and data for regions not numbered by SEC or where SEC has observed no spots.
| Solar region | Date numbered | SEC spot count |
STAR spot count |
Location at midnight | Area | Classification | Comment |
|---|---|---|---|---|---|---|---|
| 10482 | 2003.10.17 | 1 | 1 | N14W08 | 0010 | HSX |
classification was AXX at midnight, area 0000 |
| 10483 | 2003.10.17 | 5 | 3 | S10E00 | 0020 | BXO | |
| 10484 | 2003.10.17 | 56 | 49 | N04E13 | 1750 | EKC | gamma-delta |
| 10485 | 2003.10.21 | 4 | 5 | S06E34 | 0020 | BXO |
classification was CSO at midnight, area 0030 |
| 10486 | 2003.10.22 | 1 | 8 | S16E81 | 0150 | HKX |
beta-gamma-delta
classification was DKC at midnight, area 1200 |
| S282 | emerged on 2003.10.22 |
2 | S02W35 | 0010 | BXO | ||
| S283 | emerged on 2003.10.22 |
1 | S13W36 | 0010 | AXX | ||
| Total spot count: | 67 | 69 | |||||
| SSN: | 117 | 139 | |||||
| Month | Average solar flux at Earth |
International sunspot number | Smoothed sunspot number |
|---|---|---|---|
| 2000.04 | 184.2 | 125.5 | 120.8 cycle 23 sunspot max. |
| 2000.07 | 202.3 | 170.1 | 119.8 |
| 2001.12 | 235.1 | 132.2 | 114.6 (-0.9) |
| 2002.09 | 175.8 | 109.6 | 94.6 (-4.1) |
| 2002.10 | 167.0 | 97.5 | 90.5 (-4.1) |
| 2002.11 | 168.7 | 95.5 | 85.2 (-5.3) |
| 2002.12 | 157.2 | 80.8 | 82.0 (-3.2) |
| 2003.01 | 144.0 | 79.7 | 80.9 (-1.1) |
| 2003.02 | 124.5 | 46.0 | 78.5 (-2.4) |
| 2003.03 | 131.4 | 61.1 | 74.1 (-4.4) |
| 2003.04 | 126.4 | 60.0 | (69.6 predicted, -4.5) |
| 2003.05 | 115.7 | 55.2 | (65.3 predicted, -4.3) |
| 2003.06 | 129.3 | 77.4 | (61.5 predicted, -3.8) |
| 2003.07 | 127.7 | 85.0 | (58.0 predicted, -3.5) |
| 2003.08 | 122.1 | 72.7 | (55.0 predicted, -3.0) |
| 2003.09 | 112.2 | 48.8 | (53.0 predicted, -2.0) |
| 2003.10 | 114.5 (1) | 55.7 (2) | (50.3 predicted, -2.7) |
1) Running average based on the daily 20:00 UTC observed solar flux value at 2800 MHz.
2) Unofficial, accumulated value based on the Boulder (NOAA/SEC) sunspot number. The official international sunspot number is typically
30-50% less.
This report has been prepared by Jan Alvestad. It is based partly on my own observations and analysis, and partly on data from sources noted in solar links. All time references are to the UTC day. Comments and suggestions are always welcome.
| [DX-Listeners' Club] |