
Last update issued on October 6, 2003 at 03:45 UTC.
[Solar and geomagnetic data - last month (updated daily)]
[Solar wind and electron fluence charts (updated daily)]
[Solar cycles 21-23 (last update October 4, 2003)]
[Solar cycles 1-20]
[Graphical comparison of cycles 21, 22 and 23 (last update October 4, 2003)]
[Graphical comparison of cycles 2, 10, 13, 17, 20 and 23 (last update October
4, 2003)]
[Historical solar and geomagnetic data charts 1954-2003 (last update July 23, 2003)]
[Archived reports (last update September 29, 2003)]
The geomagnetic field was very quiet to active on October 5. Solar wind speed ranged between 333 and 503 km/sec. A high speed stream from coronal hole CH61 arrived at ACE at approximately 16h UTC. The interplanetary magnetic field was moderately to strongly southwards at times between 19 and 21h UTC. Since then the IMF has been mostly northwards resulting in a significant decrease in the geomagnetic disturbance level.
Solar flux measured at 20h UTC on 2.8 GHz was 109.6. The planetary A
index was 9 (STAR Ap - based on the mean of three hour interval ap indices: 10.4).
Three hour interval K indices: 221223334 (planetary), 11012134 (Boulder).
The background x-ray flux is at the class B2 level.
At midnight there were 3 spotted regions on the visible disk. Solar flare activity was low. A total of 6 C class events was recorded during the day. Optically uncorrelated flares: C2.6 at 09:20 and C1.0 at 11:06 UTC.
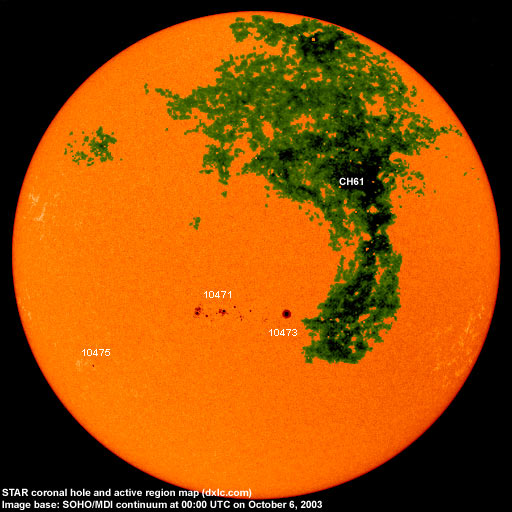
Region 10471 decayed in the leader spots while slow development was observed in the trailing spots. There is still a
magnetic delta structure in a central penumbra. Flares: C1.0 at 00:37, C1.5 at 01:39 and
C4.2 at 13:28 UTC.
Region 10473 developed some small trailing spots, all in the same (negative) polarity as the dominant spot. Flare:
C1.2 at 03:12 UTC.
New region 10475 emerged in the southeast quadrant on October 4 an d was numbered by SEC the next day.
October 3-5: No potentially geoeffective CMEs observed.
Coronal hole history (since late October 2002)
Compare today's report with the situation one solar rotation ago: 28
days ago 27 days ago 26 days ago
A coronal hole (CH61) in the northern hemisphere and with a trans equatorial extension was in a geoeffective position on October 3-4.
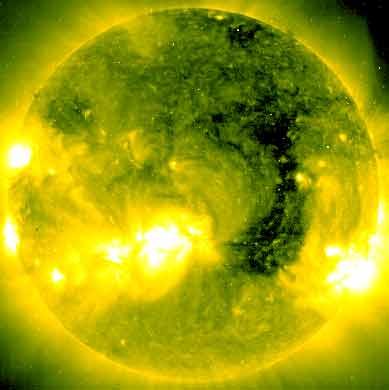
Processed SOHO/EIT 284 image at 19:06 UTC on October 5. The darkest areas on the solar disk are likely coronal holes.
The geomagnetic field is expected to be quiet to active October 6-7 due to a high speed stream from coronal hole CH61. Quiet to unsettled is likely on October 8-10.
Long distance low frequency (below 2 MHz) propagation along east-west paths over high and upper middle latitudes is very poor. Propagation along north-south paths is poor. [Trans Atlantic propagation conditions are currently monitored every night on 1470 kHz. Dominant station tonight: Cadena Peruana de Noticias].
| Coronal holes (1) | Coronal mass ejections (2) | M and X class flares (3) |
1) Effects from a coronal hole could reach Earth within the next 5 days.
2) Material from a CME is likely to impact Earth within 96 hours.
3) There is a possibility of either M or X class flares within the next 48 hours.
Green: 0-20% probability, Yellow: 20-60% probability, Red: 60-100% probability.
Compare to the previous day's image.
Data for all numbered solar regions according to the Solar Region Summary provided by NOAA/SEC. Comments are my own, as is the STAR spot count (spots observed at or inside a few hours before midnight) and data for regions not numbered by SEC or where SEC has observed no spots.
| Solar region | Date numbered | SEC spot count |
STAR spot count |
Location at midnight | Area | Classification | Comment |
|---|---|---|---|---|---|---|---|
| 10470 | 2003.09.29 | 2 | S17W52 | CSO | spotless | ||
| 10471 | 2003.09.30 | 38 | 35 | S08E09 | 0150 | EKC |
beta-gamma-delta classification was EAI at midnight |
| 10472 | 2003.10.01 | S22W60 | |||||
| 10473 | 2003.10.03 | 7 | 9 | S09W06 | 0130 | CHO |
classification was CSO at midnight |
| 10474 | 2003.10.04 | 1 | S14W62 | 0010 | AXX | spotless | |
| 10475 | 2003.10.05 | 3 | 3 | S22E47 | 0020 | CSO |
formerly region S271 classification was HSX at midnight, single polarity, narrowly spaced spots |
| S267 | emerged on 2003.09.29 |
S18W37 | plage | ||||
| S268 | emerged on 2003.09.30 |
N25W77 | plage | ||||
| S269 | emerged on 2003.10.02 |
N10W36 | plage | ||||
| S270 | emerged on 2003.10.04 |
S14W49 | plage | ||||
| Total spot count: | 51 | 47 | |||||
| SSN: | 101 | 77 | |||||
| Month | Average solar flux at Earth |
International sunspot number | Smoothed sunspot number |
|---|---|---|---|
| 2000.04 | 184.2 | 125.5 | 120.8 cycle 23 sunspot max. |
| 2000.07 | 202.3 | 170.1 | 119.8 |
| 2001.12 | 235.1 | 132.2 | 114.6 (-0.9) |
| 2002.08 | 183.6 | 116.4 | 98.7 (-4.0) |
| 2002.09 | 175.8 | 109.6 | 94.6 (-4.1) |
| 2002.10 | 167.0 | 97.5 | 90.5 (-4.1) |
| 2002.11 | 168.7 | 95.5 | 85.2 (-5.3) |
| 2002.12 | 157.2 | 80.8 | 82.0 (-3.2) |
| 2003.01 | 144.0 | 79.7 | 80.9 (-1.1) |
| 2003.02 | 124.5 | 46.0 | 78.5 (-2.4) |
| 2003.03 | 131.4 | 61.1 | 74.1 (-4.4) |
| 2003.04 | 126.4 | 60.0 | (69.6 predicted, -4.5) |
| 2003.05 | 115.7 | 55.2 | (65.3 predicted, -4.3) |
| 2003.06 | 129.3 | 77.4 | (61.5 predicted, -3.8) |
| 2003.07 | 127.7 | 85.0 | (58.0 predicted, -3.5) |
| 2003.08 | 122.1 | 72.7 | (55.0 predicted, -3.0) |
| 2003.09 | 112.2 | 48.8 | (53.0 predicted, -2.0) |
| 2003.10 | 122.1 (1) | 16.0 (2) | (50.3 predicted, -2.7) |
1) Running average based on the daily 20:00 UTC observed solar flux value at 2800 MHz.
2) Unofficial, accumulated value based on the Boulder (NOAA/SEC) sunspot number. The official international sunspot number is typically
30-50% less.
This report has been prepared by Jan Alvestad. It is based partly on my own observations and analysis, and partly on data from sources noted in solar links. All time references are to the UTC day. Comments and suggestions are always welcome.
| [DX-Listeners' Club] |