
Last update issued on October 3, 2003 at 03:35 UTC.
[Solar and geomagnetic data - last month (updated daily)]
[Solar wind and electron fluence charts (updated daily)]
[Solar cycles 21-23 (last update September 1, 2003)]
[Solar cycles 1-20]
[Graphical comparison of cycles 21, 22 and 23 (last update September 1, 2003)]
[Graphical comparison of cycles 2, 10, 13, 17, 20 and 23 (last update September
1, 2003)]
[Historical solar and geomagnetic data charts 1954-2003 (last update July 23, 2003)]
[Archived reports (last update September 29, 2003)]
The geomagnetic field was quiet to unsettled on October 2. Solar wind speed ranged between 275 and 537 km/sec. The unusual disturbance which began on October 1 continued on October 2. The interplanetary magnetic field was northwards until about 20h UTC after which time increasingly more frequent and stronger southwards excursions have been observed.
Solar flux measured at 20h UTC on 2.8 GHz was 124.8. The planetary A
index was 9 (STAR Ap - based on the mean of three hour interval ap indices: 10.0).
Three hour interval K indices: 23222333 (planetary), 23113213 (Boulder).
The background x-ray flux is at the class B4 level.
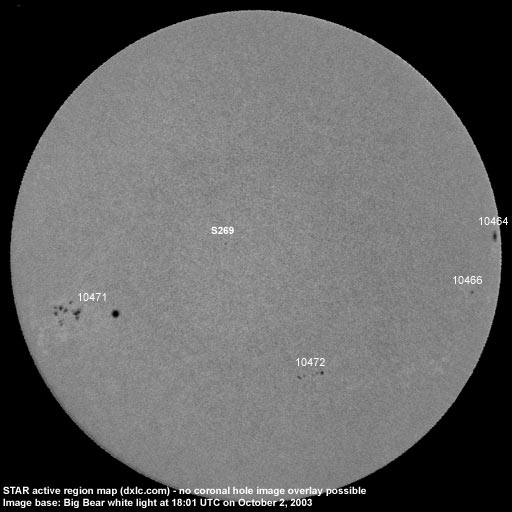
At midnight there were 5 spotted regions on the visible disk. Solar flare activity was low. A total of 4 C class events was recorded during the day. A C2.2 flare at 13:56 UTC was optically uncorrelated.
Region 10464 rotated partly out of view at the northwest limb. Flares: C2.4 at
04:01 and C7.8/1F at 06:56 UTC.
Region 10466 decayed slowly and quietly. The region could become spotless before rotating over the southwest limb
on October 4.
Region 10471 developed moderately quickly in the trailing spot section where polarities are intermixed. A minor M class
flare is possible. Flare: C4.2 at 16:11 UTC.
Region 10472 developed further with new intermediate spots emerging.
Spotted regions not numbered by NOAA/SEC:
[S269] A new region emerged in the northeast quadrant on October 2. Location at midnight: N10E03.
September 30 - October 2: No potentially geoeffective CMEs observed.
Coronal hole history (since late October 2002)
Compare today's report with the situation one solar rotation ago: 28
days ago 27 days ago
26 days ago
No obvious coronal holes are currently approaching geoeffective positions.

Processed SOHO/EIT 284 image at 19:06 UTC on September 25. The darkest areas on the solar disk are likely coronal holes.
The geomagnetic field is expected to be unsettled to minor storm on October 3 and quiet to unsettled October 4-6.
Long distance low frequency (below 2 MHz) propagation along east-west paths over high and upper middle latitudes is fair. Propagation along north-south paths is fair to good. [Trans Atlantic propagation conditions are currently monitored every night on 1470 kHz. Dominant station tonight: Radio Vibraci�n (Venezuela) with a strong signal. Signals from both medium (European) and long distance (trans Atlantic) stations are elevated about 15 dB above normal. The current solar wind disturbance seems to have energized the propagation layers].
| Coronal holes (1) | Coronal mass ejections (2) | M and X class flares (3) |
1) Effects from a coronal hole could reach Earth within the next 5 days.
2) Material from a CME is likely to impact Earth within 96 hours.
3) There is a possibility of either M or X class flares within the next 48 hours.
Green: 0-20% probability, Yellow: 20-60% probability, Red: 60-100% probability.
Compare to the previous day's image.
Data for all numbered solar regions according to the Solar Region Summary provided by NOAA/SEC. Comments are my own, as is the STAR spot count (spots observed at or inside a few hours before midnight) and data for regions not numbered by SEC or where SEC has observed no spots.
| Solar region | Date numbered | SEC spot count |
STAR spot count |
Location at midnight | Area | Classification | Comment |
|---|---|---|---|---|---|---|---|
| 10464 | 2003.09.20 | 1 | 1 | N05W81 | 0230 | HHX |
classification was HSX at midnight, area 0180 |
| 10465 | 2003.09.22 | S02W84 | plage | ||||
| 10466 | 2003.09.22 | 1 | 1 | S05W64 | 0020 | HSX | |
| 10467 | 2003.09.23 | S11W71 (SEC: S05W64) |
|||||
| 10470 | 2003.09.29 | 2 | S14W08 | 0020 | HSX | spotless | |
| 10471 | 2003.09.30 | 16 | 22 | S08E42 | 0520 | FKO | beta-gamma |
| 10472 | 2003.10.30 | 5 | 10 | S22W16 | 0040 | DSO |
classification was DAO at midnight, area 0060 |
| S267 | emerged on 2003.09.29 |
S18E02 | plage | ||||
| S268 | emerged on 2003.09.30 |
N25W38 | plage | ||||
| S269 | emerged on 2003.10.02 |
3 | N10E03 | 0020 | CRO | ||
| Total spot count: | 25 | 37 | |||||
| SSN: | 75 | 87 | |||||
| Month | Average solar flux at Earth |
International sunspot number | Smoothed sunspot number |
|---|---|---|---|
| 2000.04 | 184.2 | 125.5 | 120.8 cycle 23 sunspot max. |
| 2000.07 | 202.3 | 170.1 | 119.8 |
| 2001.12 | 235.1 | 132.2 | 114.6 (-0.9) |
| 2002.08 | 183.6 | 116.4 | 98.7 (-4.0) |
| 2002.09 | 175.8 | 109.6 | 94.6 (-4.1) |
| 2002.10 | 167.0 | 97.5 | 90.5 (-4.1) |
| 2002.11 | 168.7 | 95.5 | 85.2 (-5.3) |
| 2002.12 | 157.2 | 80.8 | 82.0 (-3.2) |
| 2003.01 | 144.0 | 79.7 | 80.9 (-1.1) |
| 2003.02 | 124.5 | 46.0 | 78.5 (-2.4) |
| 2003.03 | 131.4 | 61.1 | 74.1 (-4.4) |
| 2003.04 | 126.4 | 60.0 | (69.6 predicted, -4.5) |
| 2003.05 | 115.7 | 55.2 | (65.3 predicted, -4.3) |
| 2003.06 | 129.3 | 77.4 | (61.5 predicted, -3.8) |
| 2003.07 | 127.7 | 85.0 | (58.0 predicted, -3.5) |
| 2003.08 | 122.1 | 72.7 | (55.0 predicted, -3.0) |
| 2003.09 | 112.2 | 48.8 | (53.0 predicted, -2.0) |
| 2003.10 | 130.8 (1) | 6.5 (2) | (50.3 predicted, -2.7) |
1) Running average based on the daily 20:00 UTC observed solar flux value at 2800 MHz.
2) Unofficial, accumulated value based on the Boulder (NOAA/SEC) sunspot number. The official international sunspot number is typically
30-50% less.
This report has been prepared by Jan Alvestad. It is based partly on my own observations and analysis, and partly on data from sources noted in solar links. All time references are to the UTC day. Comments and suggestions are always welcome.
| [DX-Listeners' Club] |