
Last major update issued on November 5, 2003 at 04:45 UTC.
[Solar and geomagnetic data - last month (updated daily)]
[Solar wind and electron fluence charts (updated daily)]
[Solar cycles 21-23 (last update November 4, 2003)]
[Solar cycles 1-20]
[Graphical comparison of cycles 21, 22 and 23 (last update November 4, 2003)]
[Graphical comparison of cycles 2, 10, 13, 17, 20 and 23 (last update November
4, 2003)]
[Historical solar and geomagnetic data charts 1954-2003 (last update October 15, 2003)]
[Archived reports (last update October 30, 2003)]
The geomagnetic field was quiet to severe storm on November 4. Solar wind speed ranged between 461 and 697 km/sec. A strong solar wind shock was observed at SOHO at 05:53 UTC when solar wind speed increased abruptly from 512 to 696 km/sec. This was the arrival of the CME observed after an X8 flare in region 10486 on November 2. The interplanetary magnetic field was initially northwards, then swung strongly southwards until just before 10h UTC. Since then the IMF has been northwards.
Solar flux measured at 20h UTC on 2.8 GHz was 168.4. The planetary A
index was 31 (STAR Ap - based on the mean of three hour interval ap indices: 33.4).
Three hour interval K indices: 32573343 (planetary), 32533243 (Boulder).
The background x-ray flux is at the class C3 level.
At midnight there were 3 spotted regions on the visible disk. Solar flare activity was very high. A total of 10 C, 4 M and 1 X class events was recorded during the day.
Region 10486 rotated over the southwest limb. One hour after noon there were signs that the region was preparing for another large
flare. With the corona above the region easily visible at the limb activity continued to increase until the largest flare ever
observed was recorded during the evening. The region could produce further major (proton) flares from behind the limb today and
tomorrow. Flares: X25+/3B (conservative estimate, this flare was recorded by GOES as
X17.4. Sensor saturation was observed for about 15 minutes while the flare was still developing rapidly and this flare may have
exceeded the X30 level) at 19:53 UTC. This was a fairly small proton flare as well. Other flares: C3.2 at 02:34, M2.6 at 05:56,
C3.8 at 08:02, C5.7 at 11:19, M1.1 at 13:49 and C7.6 at 16:18 UTC.
Region 10487 decayed fairly quickly and will likely become spotless today.
Region 10488 rotated out of view at the northwest limb. A major flare is possible today and tomorrow while the region is just
behind the limb. Flares: C5.0 at 04:11, C7 at 04:45, C6.8 at 07:05, C2.8 at 09:43, M3.0 at
10:22, C8.5 at 15:05, C8 at 17:54 and M1.5 at 23:21 UTC.
Region 10495 decayed slowly and could lose its trailing spots today.
Spotted regions not numbered by NOAA/SEC:
[S299] A new region emerged east of region 10495 on November 4. Location at midnight: S22W32.
November 4: A fast, large, full halo CME was observed in LASCO C2 images beginning at 12:04 UTC. With no obvious frontside source the source of this CME is likely to have been near the center of the backside, probably in old region 10484.
A huge and very fast full halo CME was observed after the super flare in region 10486 at 19:53 UTC. The speed of this CME has been estimated at nearly 2400 km/sec. While the core of the CME will not reach the Earth, the slower flank part could impact Earth early on November 6.
November 3: No partially or fully Earth directed CMEs observed.
Coronal hole history (since late October 2002)
Compare today's report with the situation one solar rotation ago: 28
days ago 27 days ago 26 days ago
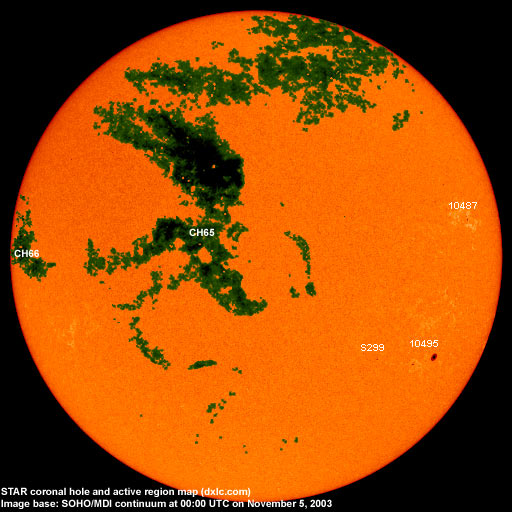
A small coronal hole (CH65) in the northern hemisphere and with a trans equatorial extension could rotate into a geoeffective position on November 5-6. A recurrent coronal hole (CH66) is rotating into view at the east limb and will likely reach a geoeffective position on November 9.
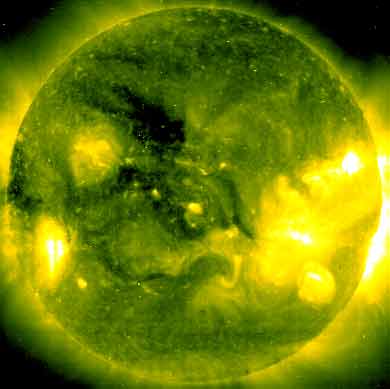
Processed SOHO/EIT 284 image at 19:06 UTC on November 4. The darkest areas on the solar disk are likely coronal holes.
The geomagnetic field is expected to be quiet to active on November 5. A sideways CME impact is expected during the first half of November 6 and this will likely cause a brief interval of severe geomagnetic storming. Quiet to unsettled is likely on November 7 with a few unsettled to active intervals possible on November 8-9 due to a high speed stream from coronal hole CH65.
Long distance low frequency (below 2 MHz) propagation along east-west paths over high and upper middle latitudes is very poor. Propagation along long distance north-south paths is poor. [Trans Atlantic propagation conditions are currently monitored every night on 1470 kHz. Dominant station: Radio Cristal del Uruguay].
| Coronal holes (1) | Coronal mass ejections (2) | M and X class flares (3) |
1) Effects from a coronal hole could reach Earth within the next 5 days.
2) Material from a CME is likely to impact Earth within 96 hours.
3) There is a possibility of either M or X class flares within the next 48 hours.
Green: 0-20% probability, Yellow: 20-60% probability, Red: 60-100% probability.
Compare to the previous day's image.
Data for all numbered solar regions according to the Solar Region Summary provided by NOAA/SEC. Comments are my own, as is the STAR spot count (spots observed at or inside a few hours before midnight) and data for regions not numbered by SEC or where SEC has observed no spots.
| Solar region | Date numbered | SEC spot count |
STAR spot count |
Location at midnight | Area | Classification | Comment |
|---|---|---|---|---|---|---|---|
| 10486 | 2003.10.22 | 15 | S17W89 | 0630 | EKC | rotated out of view | |
| 10487 | 2003.10.25 | 3 | 2 | N12W61 | 0020 | CSO |
classification was HRX at midnight |
| 10488 | 2003.10.27 | 1 | N08W95 | 0320 | HAX | rotated out of view | |
| 10490 | 2003.10.27 | S12W79 | plage | ||||
| 10494 | 2003.10.30 | S23W57 | plage | ||||
| 10495 | 2003.10.30 | 7 | 4 | S22W48 | 0120 | DHO |
classification was DSO at midnight, area 0090 |
| 10496 | 2003.10.31 | S12W43 | plage | ||||
| 10497 | 2003.11.04 | 3 | N10W45 | 0010 | BXO | spotless | |
| S294 | emerged on 2003.10.29 |
S09W33 | plage | ||||
| S296 | emerged on 2003.11.01 |
S07W13 | plage | ||||
| S297 | emerged on 2003.11.03 |
N12W06 | plage | ||||
| S298 | emerged on 2003.11.03 |
N13W12 | plage | ||||
| S299 | emerged on 2003.11.04 |
2 | S22W32 | 0010 | AXX | ||
| Total spot count: | 29 | 8 | |||||
| SSN: | 79 | 38 | |||||
| Month | Average solar flux at Earth |
International sunspot number | Smoothed sunspot number |
|---|---|---|---|
| 2000.04 | 184.2 | 125.5 | 120.8 cycle 23 sunspot max. |
| 2000.07 | 202.3 | 170.1 | 119.8 |
| 2001.12 | 235.1 | 132.2 | 114.6 (-0.9) |
| 2002.10 | 167.0 | 97.5 | 90.5 (-4.1) |
| 2002.11 | 168.7 | 95.5 | 85.2 (-5.3) |
| 2002.12 | 157.2 | 80.8 | 82.0 (-3.2) |
| 2003.01 | 144.0 | 79.7 | 80.9 (-1.1) |
| 2003.02 | 124.5 | 46.0 | 78.5 (-2.4) |
| 2003.03 | 131.4 | 61.1 | 74.1 (-4.4) |
| 2003.04 | 126.4 | 60.0 | 70.3 (-3.8) |
| 2003.05 | 115.7 | 55.2 | (66.8 predicted, -3.5) |
| 2003.06 | 129.3 | 77.4 | (63.0 predicted, -3.8) |
| 2003.07 | 127.7 | 85.0 | (59.3 predicted, -3.7) |
| 2003.08 | 122.1 | 72.7 | (56.3 predicted, -3.0) |
| 2003.09 | 112.2 | 48.8 | (54.3 predicted, -2.0) |
| 2003.10 | 151.7 | 65.6 | (51.6 predicted, -2.7) |
| 2003.11 | 184.0 (1) | 20.2 (2) | (48.9 predicted, -2.7) |
1) Running average based on the daily 20:00 UTC observed solar flux value at 2800 MHz.
2) Unofficial, accumulated value based on the Boulder (NOAA/SEC) sunspot number. The official international sunspot number is typically
30-50% less.
This report has been prepared by Jan Alvestad. It is based partly on my own observations and analysis, and partly on data from sources noted in solar links. All time references are to the UTC day. Comments and suggestions are always welcome.
| [DX-Listeners' Club] |