
Last update issued on June 14, 2003 at 02:30 UTC. Minor update posted at 06:15 UTC.
[Solar and geomagnetic data - last month (updated daily)]
[Solar wind and electron fluence charts (updated daily)]
[Solar cycles 21-23 (last update June 3, 2003)]
[Solar cycles 1-20]
[Graphical comparison of cycles 21, 22 and 23 (last update June 3, 2003)]
[Graphical comparison of cycles 2, 10, 13, 17, 20 and 23 (last update June 3, 2003)]
[Historical solar and geomagnetic data charts 1954-2003 (last update April 13, 2003)]
[Archived reports (last update June 10, 2003)]
The geomagnetic field was quiet to active on June 13. Solar wind speed ranged between 370 and 476 km/sec. Solar wind speed began increasing after 17h UTC as the high speed stream from coronal hole CH43 began to dominate the solar wind.
Solar flux measured at 20h UTC on 2.8 GHz was 151.0. The planetary A
index was 11 (STAR Ap - based on the mean of three hour interval ap indices: 12.1).
Three hour interval K indices: 32122344 (planetary), 21110233 (Boulder). [SEC are still
mistakenly reporting their own K indices as being equal to what has been recorded at the magnetometer at College, Alaska. The indices reported by USAF are used instead.]
The background x-ray flux is at the class C3 level.
At midnight there were 6 spotted regions on the visible disk. Solar flare activity was moderate. A total of 8 C and 3 M class events was recorded during the day.
Region 10375 decayed slowly as most of the region rotated over the northwest limb. A major flare is possible while the region is at and just behind the limb during the next
2 days. Flares: C4.1 at 01:19, M3.1 at 02:04, M1.7 at 04:37, M1.8 at 06:45, C2.7 at 11:51,
C3.2 at 13:43, C4.0 at 15:06, C4.4 at 16:23, C4.6 at 17:34, C8.7 long duration event
peaking at 20:34 and C3.8 at 23:15 UTC.
Region 10377 decayed slowly and quietly.
Region 10380 decayed fairly quickly and was mostly quiet. An M class flare is still possible.
Region 10381 was mostly quiet and stable.
Region 10382 decayed slowly and lost several spots.
Region 10384 developed slowly and has a weak magnetic delta structure in the main penumbra.
Comment added at 06:15 UTC on June 14: A region just behind the southeast limb produced a long duration M1.5 event peaking at 06h UTC. Earlier today region 10380 generated a C8 flare.
June 11: A CME was observed in SXI images in association with the M4 event in region 10375 peaking at 15:24 UTC. A much larger CME was observed following an M1.8 event in region 10380 (peaking at 17:47 UTC). This flare triggered a large filament eruption south and southwest of the region. The CME could reach Earth and cause a geomagnetic disturbance on June 14.
June 12: No observations.
June 13: No obviously geoeffective CMEs observed. A filament across the central meridian in the northern hemisphere began to erupt late in the day and may have been associated with a small CME.
Coronal hole history (since late October 2002)
Compare today's report with the situation one solar rotation ago: 28
days ago 27 days ago 26 days ago
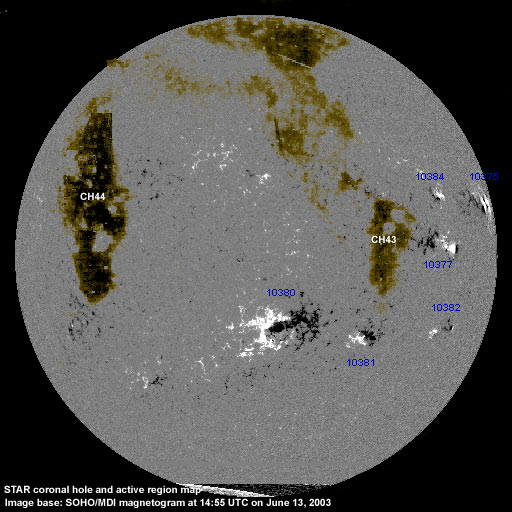
A coronal hole (CH43) mainly in the northern hemisphere and with a trans equatorial extension, was in a geoeffective position on June 11. A recurrent trans equatorial coronal hole (CH44) will likely rotate into a geoeffective position on June 17.

Processed SOHO EIT 284 image at 19:06 UTC on June 13. Any black areas on the solar disk are likely coronal holes.
The geomagnetic field is expected to be unsettled to active on June 14-15 due to a high speed stream from coronal hole CH43.
Long distance medium wave (AM) band propagation along east-west paths over high and upper middle latitudes is very poor and will likely be very poor until at least June 17. Propagation along north-south paths is fair. [Trans Atlantic propagation conditions are currently monitored every night on 1470 kHz. Dominant station tonight: Radio Cristal del Uruguay, a couple of stations from Brazil were noted as well.]
| Coronal holes (1) | Coronal mass ejections (2) | M and X class flares (3) |
1) Effects from a coronal hole could reach Earth within the next 5 days.
2) Material from a CME is likely to impact Earth within 96 hours.
3) There is a possibility of either M or X class flares within the next 48 hours.
Green: 0-20% probability, Yellow: 20-60% probability, Red: 60-100% probability.
Compare to the previous day's image.
Data for all numbered solar regions according to the Solar Region Summary provided by NOAA/SEC. Comments are my own, as is the STAR spot count (spots observed at or inside a few hours before midnight) and data for regions not numbered by SEC or where SEC has observed no spots.
| Solar region | Date numbered | SEC spot count |
STAR spot count |
Location at midnight | Area | Classification | Comment |
|---|---|---|---|---|---|---|---|
| 10375 | 2003.06.01 | 12 | 12 | N12W84 | 0550 | EKC |
beta-gamma-delta rotated partly out of view |
| 10377 | 2003.06.04 | 5 | 4 | N03W58 | 0140 | CSO | |
| 10378 | 2003.06.05 | N15W39 | plage | ||||
| 10380 | 2003.06.07 | 48 | 33 | S16W11 | 0500 | FKI | beta-gamma |
| 10381 | 2003.06.09 | 15 | 11 | S20W34 | 0110 | DAI | |
| 10382 | 2003.06.10 | 3 | 3 | S18W60 | 0040 | DRO | |
| 10383 | 2003.06.11 | N19W04 | plage | ||||
| 10384 | 2003.06.12 | 6 | 8 | N15W56 | 0060 | DAO | beta-gamma-delta |
| S180 | emerged on 2003.06.07 |
S07W64 | plage | ||||
| S181 | emerged on 2003.06.08 |
N15W54 | plage | ||||
| Total spot count: | 89 | 71 | |||||
| SSN: | 149 | 131 | |||||
| Month | Average solar flux at Earth |
International sunspot number | Smoothed sunspot number |
|---|---|---|---|
| 2000.04 | 184.2 | 125.5 | 120.8 cycle 23 sunspot max. |
| 2000.07 | 202.3 | 170.1 | 119.8 |
| 2001.12 | 235.1 | 132.2 | 114.6 (-0.9) |
| 2002.05 | 178.4 | 120.8 | 108.8 (-1.7) |
| 2002.06 | 148.7 | 88.3 | 106.2 (-2.6) |
| 2002.07 | 173.5 | 99.6 | 102.7 (-3.5) |
| 2002.08 | 183.6 | 116.4 | 98.7 (-4.0) |
| 2002.09 | 175.8 | 109.6 | 94.6 (-4.1) |
| 2002.10 | 167.0 | 97.5 | 90.5 (-4.1) |
| 2002.11 | 168.7 | 95.5 | 85.2 (-5.3) |
| 2002.12 | 157.2 | 80.8 | (81.4 predicted, -3.8) |
| 2003.01 | 144.0 | 79.5 | (78.3 predicted, -3.1) |
| 2003.02 | 124.5 | 46.2 | (73.3 predicted, -5.0) |
| 2003.03 | 131.4 | 61.5 | (67.6 predicted, -5.7) |
| 2003.04 | 126.4 | 60.0 | (62.7 predicted, -4.9) |
| 2003.05 | 115.7 | 55.2 | (57.8 predicted, -4.9) |
| 2003.06 | 140.1 (1) | 53.9 (2) | (53.8 predicted, -4.0) |
1) Running average based on the daily 20:00 UTC observed solar flux value at 2800 MHz.
2) Unofficial, accumulated value based on the Boulder (NOAA/SEC) sunspot number. The official international sunspot number is typically
30-50% less.
This report has been prepared by Jan Alvestad. It is based partly on my own observations and interpretations, and partly on data from sources noted in solar links. All time references are to the UTC day. Comments and suggestions are always welcome.
| [DX-Listeners' Club] |