
Last update issued on June 10, 2003 at 03:20 UTC. Minor update posted at 11:00 UTC.
[Solar and geomagnetic data - last month (updated daily)]
[Solar wind and electron fluence charts (updated daily)]
[Solar cycles 21-23 (last update June 3, 2003)]
[Solar cycles 1-20]
[Graphical comparison of cycles 21, 22 and 23 (last update June 3, 2003)]
[Graphical comparison of cycles 2, 10, 13, 17, 20 and 23 (last update June 3, 2003)]
[Historical solar and geomagnetic data charts 1954-2003 (last update April 13, 2003)]
[Archived reports (last update June 10, 2003)]
The geomagnetic field was unsettled to major storm on June 9. Solar wind speed ranged between 577 and 754 km/sec, mainly under the influence of a high speed stream from coronal hole CH42. A CME embedded within the coronal hole flow may have arrived after 11h UTC and caused an increase in geomagnetic activity late in the day.
Solar flux measured at 20h UTC on 2.8 GHz was 158.3. The planetary A
index was 28 (STAR Ap - based on the mean of three hour interval ap indices: 29.3).
Three hour interval K indices: 34443346 (planetary), 34433346 (Boulder).
The background x-ray flux is at the class C2 level.
At midnight there were 6 spotted regions on the visible disk. Solar flare activity was high. A total of 23 C, 3 M and 1 X class events was recorded during the day.
Region 10375 developed further with most of the development occurring in the leading spot section. No less than 4 areas
of negative polarity magnetic flux emerged inside the dominant leading magnetically positive area and caused the formation of 3
new magnetic delta structures in addition to the strong delta in the trailing spots. Further X class flares are likely and there
may even be a possibility of an X10+ proton flare. Flares: C2.8 at 04:09, C3.0 at 07:08, C3.3
at 09:02, C4.0 at 10:19, M5.0/1N (associated with a strong type II radio sweep) at 11:28, C5.3 at 14:38, C5.9 at 16:29, C5.4 at
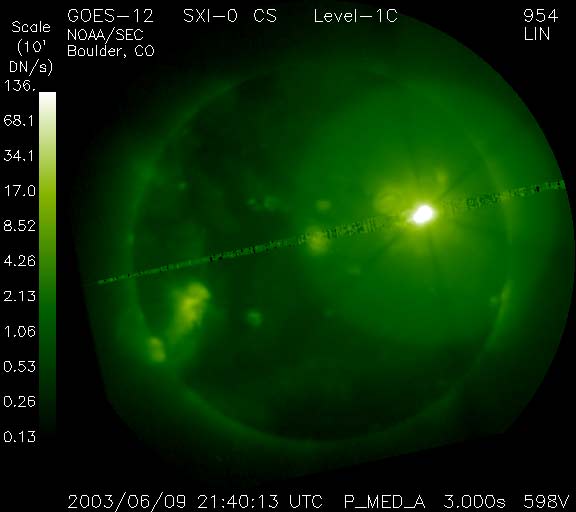
17:07, C9.4 at 19:01, C3.4 at 20:25, C7.1 at 20:57, C4.8 at 21:12, impulsive X1.7 (associated with a strong type II and a weak
type IV radio sweep) at 21:39 (see GOES SXI image), M1.1 at 22:11, M1.4 (location
actually just north of the region, may have been an S shaped filament eruption) at 22:31, C6.7 at 23:28, C5.8 at 23:37 and C5.1 at
23:45 UTC. The flares during the last hours occurred in several separate locations in the region.
Region 10377 developed slowly and quietly.
Region 10378 decayed slowly and quietly.
Region 10380 decayed slightly in the northernmost spots but remains a complex region with a magnetic delta structure
within the large penumbra. A major flare is possible. Should such an event occur it could trigger the eruption of a large filament
extending from this region and well into the northern hemisphere. Flares: C8.8 at 01:15 and
C5.0 at 19:32 UTC.
New region 10381 emerged in the southeast quadrant.
Spotted regions not yet numbered by NOAA/SEC:
[S181] A new region emerged to the north of region 10377 in the northeast quadrant on June 8 and developed slowly on June
9. Location at midnight: N15W02.
Comment added at 11:00 UTC on June 10: Another burst of activity between 07 and 08:30 UTC caused major geomagnetic storming with the planetary A index reaching 77 during the 06-09h UTC interval.
June 7-8: No obviously geoeffective CMEs observed.
June 9: A halo CME was observed in LASCO images late in the day after the X1 event in region 10375. The major part of the ejected material was observed off of the northwest limb. The CME could reach Earth during the latter half of June 11 and cause major geomagnetic storming.
Coronal hole history (since late October 2002)
Compare today's report with the situation one solar rotation ago: 28
days ago 27 days ago 26 days ago
A huge recurrent coronal hole (CH42) in the southern hemisphere was in a geoeffective position on May 29-June 6. A coronal hole (CH43) mainly in the northern hemisphere and with a trans equatorial extension, will rotate into a geoeffective position on June 11-12.

Processed SOHO EIT 284 image at 19:06 UTC on June 9. Any black areas on the solar disk are likely coronal holes.
The geomagnetic field is expected to be unsettled to minor storm on June 10 and unsettled to major storm on June 11-12. On June 14-15 a high speed stream from coronal hole CH43 will likely dominate the solar wind and cause unsettled to active conditions.
Long distance medium wave (AM) band propagation along east-west paths over high and upper middle latitudes is useless and will likely be very poor until at least June 17. Propagation along north-south paths is poor. [Trans Atlantic propagation conditions are currently monitored every night on 1470 kHz. Dominant station tonight: Radio Cristal del Uruguay with a weak signal.]
| Coronal holes (1) | Coronal mass ejections (2) | M and X class flares (3) |
1) Effects from a coronal hole could reach Earth within the next 5 days.
2) Material from a CME is likely to impact Earth within 96 hours.
3) There is a possibility of either M or X class flares within the next 48 hours.
Green: 0-20% probability, Yellow: 20-60% probability, Red: 60-100% probability.

Compare to the previous day's image.
Data for all numbered solar regions according to the Solar Region Summary provided by NOAA/SEC. Comments are my own, as is the STAR spot count (spots observed at or inside a few hours before midnight) and data for regions not numbered by SEC or where SEC has observed no spots.
| Solar region | Date numbered | SEC spot count |
STAR spot count |
Location at midnight | Area | Classification | Comment |
|---|---|---|---|---|---|---|---|
| 10373 | 2003.05.27 | 1 | N04W92 | 0070 | HSX | rotated out of view | |
| 10375 | 2003.06.01 | 54 | 77 | N12W32 | 0870 | FKC | gamma-delta |
| 10376 | 2003.06.02 | S11W83 (SEC: S14W70) |
location corrected see region S178 |
||||
| 10377 | 2003.06.04 | 19 | 24 | N04E00 | 0130 | ESO | beta-gamma |
| 10378 | 2003.06.05 | 1 | 2 | N16E14 | 0010 | AXX |
classification was BXO at midnight |
| 10380 | 2003.06.07 | 36 | 43 | S14E41 | 0680 | EKI | beta-gamma-delta |
| 10381 | 2003.06.09 | 5 | 8 | S18E19 | 0010 | BXO | |
| S176 | emerged on 2003.06.05 |
N14W38 | plage | ||||
| S178 | emerged on 2003.06.06 |
S14W70 | now spotless | ||||
| S180 | emerged on 2003.06.07 |
S07W12 | |||||
| S181 | emerged on 2003.06.08 |
3 | N15W02 | 0010 | BXO | ||
| Total spot count: | 116 | 157 | |||||
| SSN: | 176 | 217 | |||||
| Month | Average solar flux at Earth |
International sunspot number | Smoothed sunspot number |
|---|---|---|---|
| 2000.04 | 184.2 | 125.5 | 120.8 cycle 23 sunspot max. |
| 2000.07 | 202.3 | 170.1 | 119.8 |
| 2001.12 | 235.1 | 132.2 | 114.6 (-0.9) |
| 2002.05 | 178.4 | 120.8 | 108.8 (-1.7) |
| 2002.06 | 148.7 | 88.3 | 106.2 (-2.6) |
| 2002.07 | 173.5 | 99.6 | 102.7 (-3.5) |
| 2002.08 | 183.6 | 116.4 | 98.7 (-4.0) |
| 2002.09 | 175.8 | 109.6 | 94.6 (-4.1) |
| 2002.10 | 167.0 | 97.5 | 90.5 (-4.1) |
| 2002.11 | 168.7 | 95.5 | 85.2 (-5.3) |
| 2002.12 | 157.2 | 80.8 | (81.4 predicted, -3.8) |
| 2003.01 | 144.0 | 79.5 | (78.3 predicted, -3.1) |
| 2003.02 | 124.5 | 46.2 | (73.3 predicted, -5.0) |
| 2003.03 | 131.4 | 61.5 | (67.6 predicted, -5.7) |
| 2003.04 | 126.4 | 60.0 | (62.7 predicted, -4.9) |
| 2003.05 | 115.7 | 55.2 | (57.8 predicted, -4.9) |
| 2003.06 | 126.4 (1) | 30.5 (2) | (53.8 predicted, -4.0) |
1) Running average based on the daily 20:00 UTC observed solar flux value at 2800 MHz.
2) Unofficial, accumulated value based on the Boulder (NOAA/SEC) sunspot number. The official international sunspot number is typically
30-50% less.
This report has been prepared by Jan Alvestad. It is based partly on my own observations and interpretations, and partly on data from sources noted in solar links. All time references are to the UTC day. Comments and suggestions are always welcome.
| [DX-Listeners' Club] |