
Last update issued on June 3, 2003 at 03:40 UTC.
[Solar and geomagnetic data - last month (updated daily)]
[Solar wind and electron fluence charts (updated daily)]
[Solar cycles 21-23 (last update June 3, 2003)]
[Solar cycles 1-20]
[Graphical comparison of cycles 21, 22 and 23 (last update June 3, 2003)]
[Graphical comparison of cycles 2, 10, 13, 17, 20 and 23 (last update June 3, 2003)]
[Historical solar and geomagnetic data charts 1954-2003 (last update April 13, 2003)]
[Archived reports (last update June 1, 2003)]
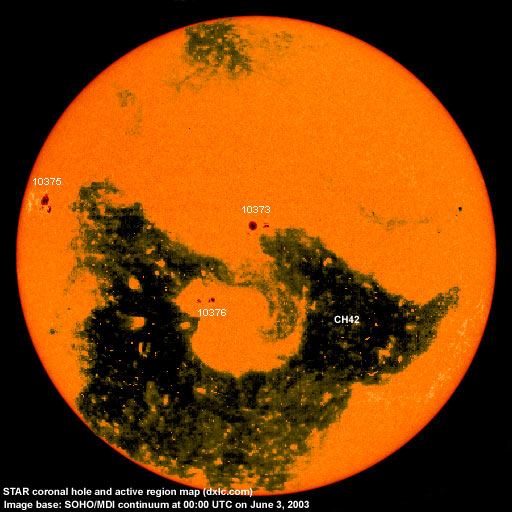
The geomagnetic field was unsettled to major storm on June 2. Solar wind speed ranged between 586 and 767 km/sec under the influence of a high speed stream from coronal hole CH42.
Solar flux measured at 20h UTC on 2.8 GHz was 121.4. The planetary A
index was 39 (STAR Ap - based on the mean of three hour interval ap indices: 39.3).
Three hour interval K indices: 54664434 (planetary), 34553334 (Boulder).
The background x-ray flux is at the class B8 level.
At midnight there were 3 spotted regions on the visible disk. Solar flare activity was high. A total of 9 C and 4 M class events was recorded during the day. Region S169 behind the southwest limb produced a major M7.0 flare (associated with a strong type II and a weak type IV radio sweep) at 00:22, a C3.1 flare at 04:10, a C2.0 flare 06:54, an M4.0 flare at 08:37, a C4.3 flare at 11:06, an M1.0 flare at 13:17 and a C9.3 flare at 15:44 UTC. Please note that NOAA/SEC in their daily flare reports has mixed data from GOES10 and GOES12. While claiming to use GOES12 data, they are actually reporting GOES10 flare intensities, i.e. the M7.0 flare recorded by GOES12 was recorded as M6.5 by GOES10. Another noteworthy example was a couple of days ago when an X1.0 flare (recorded by GOES12) in region S169, was reported as M9.3 (recorded by GOES10).
Region 10373 decayed slowly and quietly.
Region 10375 developed slowly. The region is fairly complex with two magnetic delta structures. A new delta developed
during the day as negative flux emerged at the southern edge of southernmost penumbra. The main delta structure is in the large
northern penumbra. Further M class flaring is highly likely. Flares: C2.0 at 04:26, C7.6 at
11:54, C8.0 at 12:17, M1.8 at 17:33, a long duration C3.2 event peaking at 19:28 and C3.8 at 21:47 UTC.
New region 10376 emerged quickly early in the day in the southeast quadrant. The region is simply structured.
June 1-2: Several CMEs were observed off of the west and east limbs, all of them appeared to be the result of activity in limb regions S169 and 10375.
Coronal hole history (since late October 2002)
Compare today's report with the situation one solar rotation ago: 28
days ago 27 days ago 26
days ago
A huge recurrent coronal hole (CH42) in the southern hemisphere will rotate into a geoeffective position on May 29-June 6.

Processed SOHO EIT 284 image at 19:06 UTC on June 2. Any black areas on the solar disk are likely coronal holes.
The geomagnetic field is expected to be unsettled to minor storm until June 9 due to a high speed stream from coronal hole CH42.
Long distance medium wave (AM) band propagation along east-west paths over high and upper middle latitudes is useless and will likely be very poor to useless until at least June 10. Propagation along north-south paths is fair to good. [Trans Atlantic propagation conditions are currently monitored every night on 1470 kHz. Dominant station tonight: Radio Cristal del Uruguay. Other frequencies were more interesting as reception improved a lot during the listening session, particularly 1480 kHz which had one station from Uruguay and one from Argentina.]
| Coronal holes (1) | Coronal mass ejections (2) | M and X class flares (3) |
1) Effects from a coronal hole could reach Earth within the next 5 days.
2) Material from a CME is likely to impact Earth within 96 hours.
3) There is a possibility of either M or X class flares within the next 48 hours.
Green: 0-20% probability, Yellow: 20-60% probability, Red: 60-100% probability.
Compare to the previous day's image.
Data for all numbered solar regions according to the Solar Region Summary provided by NOAA/SEC. Comments are my own, as is the STAR spot count (spots observed at or inside a few hours before midnight) and data for regions not numbered by SEC or where SEC has observed no spots.
| Solar region | Date numbered | SEC spot count |
STAR spot count |
Location at midnight | Area | Classification | Comment |
|---|---|---|---|---|---|---|---|
| 10366 | 2003.05.22 | N11W81 | plage | ||||
| 10367 | 2003.05.22 | S14W74 | plage | ||||
| 10368 | 2003.05.22 | 1 | S32W63 | 0010 | AXX | now spotless | |
| 10370 | 2003.05.23 | N16W78 | plage | ||||
| 10371 | 2003.05.27 | S13W88 | plage | ||||
| 10372 | 2003.05.27 | S14W81 | plage | ||||
| 10373 | 2003.05.27 | 10 | 10 | N06E00 | 0160 | CSO | |
| 10375 | 2003.06.01 | 6 | 17 | N12E64 | 0370 | DSO |
beta-gamma-delta classification was DKO at midnight |
| 10376 | 2003.06.02 | 4 | 10 | S12E13 | 0030 | CRO |
classification was DAO at midnight, area 0080 |
| S171 | emerged on 2003.05.28 |
S23W63 | plage | ||||
| S172 | emerged on 2003.05.28 |
S17W44 | plage | ||||
| S173 | emerged on 2003.05.28 |
N05W21 | plage | ||||
| S174 | emerged on 2003.05.30 |
N18W40 | plage | ||||
| S175 | emerged on 2003.05.31 |
N14W11 | plage | ||||
| Total spot count: | 21 | 37 | |||||
| SSN: | 61 | 67 | |||||
| Month | Average solar flux at Earth |
International sunspot number | Smoothed sunspot number |
|---|---|---|---|
| 2000.04 | 184.2 | 125.5 | 120.8 cycle 23 sunspot max. |
| 2000.07 | 202.3 | 170.1 | 119.8 |
| 2001.12 | 235.1 | 132.2 | 114.6 (-0.9) |
| 2002.05 | 178.4 | 120.8 | 108.8 (-1.7) |
| 2002.06 | 148.7 | 88.3 | 106.2 (-2.6) |
| 2002.07 | 173.5 | 99.6 | 102.7 (-3.5) |
| 2002.08 | 183.6 | 116.4 | 98.7 (-4.0) |
| 2002.09 | 175.8 | 109.6 | 94.6 (-4.1) |
| 2002.10 | 167.0 | 97.5 | 90.5 (-4.1) |
| 2002.11 | 168.7 | 95.5 | 85.2 (-5.3) |
| 2002.12 | 157.2 | 80.8 | (81.4 predicted, -3.8) |
| 2003.01 | 144.0 | 79.5 | (78.3 predicted, -3.1) |
| 2003.02 | 124.5 | 46.2 | (73.3 predicted, -5.0) |
| 2003.03 | 131.4 | 61.5 | (67.6 predicted, -5.7) |
| 2003.04 | 126.4 | 60.0 | (62.7 predicted, -4.9) |
| 2003.05 | 115.7 | 55.2 | (57.8 predicted, -4.9) |
| 2003.06 | 116.9 (1) | 4.2 (2) | (53.8 predicted, -4.0) |
1) Running average based on the daily 20:00 UTC observed solar flux value at 2800 MHz.
2) Unofficial, accumulated value based on the Boulder (NOAA/SEC) sunspot number. The official international sunspot number is typically
30-50% less.
This report has been prepared by Jan Alvestad. It is based partly on my own observations and interpretations, and partly on data from sources noted in solar links. All time references are to the UTC day. Comments and suggestions are always welcome.
| [DX-Listeners' Club] |