
Last update issued on July 30, 2003 at 04:15 UTC.
[Solar and geomagnetic data - last month (updated daily)]
[Solar wind and electron fluence charts (updated daily)]
[Solar cycles 21-23 (last update July 2, 2003)]
[Solar cycles 1-20]
[Graphical comparison of cycles 21, 22 and 23 (last update July 2, 2003)]
[Graphical comparison of cycles 2, 10, 13, 17, 20 and 23 (last update July 2, 2003)]
[Historical solar and geomagnetic data charts 1954-2003 (last update July 23, 2003)]
[Archived reports (last update July 21, 2003)]
The geomagnetic field was active to minor storm on July 29. Solar wind speed ranged between 695 and 917 km/sec under the influence of a high speed stream from coronal hole CH49. This coronal hole has been with us at least since October 2002 in various shapes. During this solar rotation it is at its most impressive with an exceptionally high maximum solar wind speed.
Solar flux measured at 20h UTC on 2.8 GHz was 99.9. The planetary A
index was 36 (STAR Ap - based on the mean of three hour interval ap indices: 37.0).
Three hour interval K indices: 45445555 (planetary), 56535455 (Boulder).
The background x-ray flux is at the class B2 level.
At midnight there were 5 spotted regions on the visible disk. Solar flare activity was moderate. A total of 3 C and 1 M class events was recorded during the day.
Region 10419 reemerged with a single spot.
Region 10420 was quiet and stable.
Region 10421 decayed with most of the decay observed in the trailing spot section. The positive and negative polarity
areas separated and the magnetic delta in the leading penumbra disappeared. Flares: impulsive M1.3/1F at 01:39
and C1.0 at 05:48 UTC.
Region 10422 was mostly unchanged and quiet. The region became substantially more active during the last hours of the day
and this activity has continued early on July 30. Flares: C1.7 at 16:41 and C1.5 at 23:54 UTC.
Spotted regions not numbered by NOAA/SEC:
[S217] A new region emerged in the northwest quadrant on July 29. Location at midnight: N15W35.
July 27-29: No potentially geoeffective CMEs observed.
Coronal hole history (since late October 2002)
Compare today's report with the situation one solar rotation ago: 28
days ago 27 days ago 26 days ago
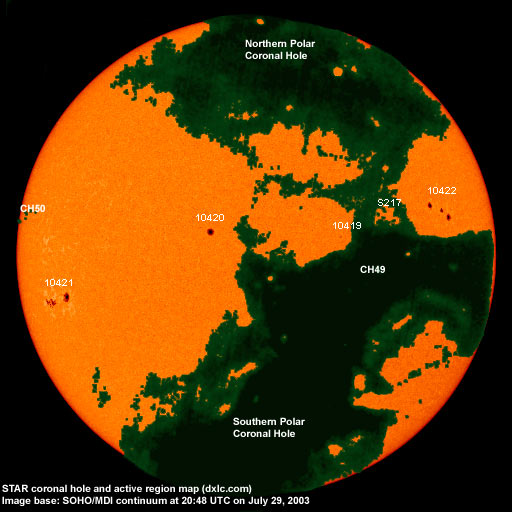
A large coronal hole (CH49) in the southern hemisphere - an extension of the southern polar coronal hole - was in a geoeffective position on July 24-29. A coronal hole (CH50) in the northern hemisphere is rotating into view at the east limb and will likely be in a geoeffective position on August 4-5.
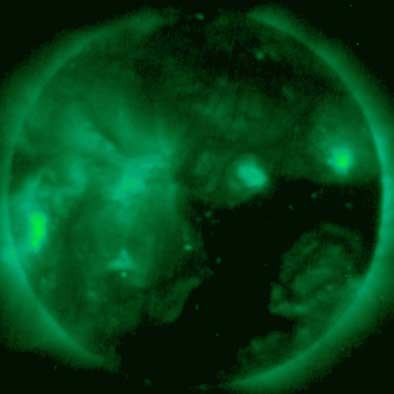
Processed GOES SXI coronal structure image at 20:46 UTC on July 29. Base SXI image courtesy of NOAA/SEC. The darkest areas on the solar disk are likely coronal holes.
The geomagnetic field is expected to be quiet to minor storm until August 2 due to a high speed stream from coronal hole CH49.
Long distance low frequency (below 2 MHz) propagation along east-west paths over high and upper middle latitudes is useless and will likely remain useless to very poor until August 3. Propagation along north-south paths is fair and expected to remain fair until August 3. [Trans Atlantic propagation conditions are currently monitored every night on 1470 kHz. Dominant station tonight: Radio Cristal del Uruguay. On other frequencies stations from Brazil (i.e. R�dio Farroupilha on 680 kHz) and Argentina were noted.]
| Coronal holes (1) | Coronal mass ejections (2) | M and X class flares (3) |
1) Effects from a coronal hole could reach Earth within the next 5 days.
2) Material from a CME is likely to impact Earth within 96 hours.
3) There is a possibility of either M or X class flares within the next 48 hours.
Green: 0-20% probability, Yellow: 20-60% probability, Red: 60-100% probability.
Compare to the previous day's image.
Data for all numbered solar regions according to the Solar Region Summary provided by NOAA/SEC. Comments are my own, as is the STAR spot count (spots observed at or inside a few hours before midnight) and data for regions not numbered by SEC or where SEC has observed no spots.
| Solar region | Date numbered | SEC spot count |
STAR spot count |
Location at midnight | Area | Classification | Comment |
|---|---|---|---|---|---|---|---|
| 10414 | 2003.07.17 | 1 | S04W91 | 0060 | HSX | rotated out of view | |
| 10419 | 2003.07.23 | 2 | N10W23 | 0010 | AXX | ||
| 10420 | 2003.07.24 | 1 | 1 | N11E11 | 0080 | HSX | |
| 10421 | 2003.07.27 | 13 | 16 | S08E54 | 0310 | EAO | |
| 10422 | 2003.07.28 | 8 | 10 | N14W54 | 0200 | DAO | beta-gamma |
| S215 | emerged on 2003.07.27 |
N04W39 | plage | ||||
| S216 | emerged on 2003.07.27 |
N17W13 | plage | ||||
| S217 | emerged on 2003.07.29 |
1 | N15W35 | 0000 | AXX | ||
| Total spot count: | 23 | 30 | |||||
| SSN: | 63 | 80 | |||||
| Month | Average solar flux at Earth |
International sunspot number | Smoothed sunspot number |
|---|---|---|---|
| 2000.04 | 184.2 | 125.5 | 120.8 cycle 23 sunspot max. |
| 2000.07 | 202.3 | 170.1 | 119.8 |
| 2001.12 | 235.1 | 132.2 | 114.6 (-0.9) |
| 2002.06 | 148.7 | 88.3 | 106.2 (-2.6) |
| 2002.07 | 173.5 | 99.6 | 102.7 (-3.5) |
| 2002.08 | 183.6 | 116.4 | 98.7 (-4.0) |
| 2002.09 | 175.8 | 109.6 | 94.6 (-4.1) |
| 2002.10 | 167.0 | 97.5 | 90.5 (-4.1) |
| 2002.11 | 168.7 | 95.5 | 85.2 (-5.3) |
| 2002.12 | 157.2 | 80.8 | 82.0 (-3.2) |
| 2003.01 | 144.0 | 79.7 | (79.7 predicted, -2.3) |
| 2003.02 | 124.5 | 46.0 | (74.7 predicted, -5.0) |
| 2003.03 | 131.4 | 61.1 | (69.0 predicted, -5.7) |
| 2003.04 | 126.4 | 60.0 | (64.1 predicted, -4.9) |
| 2003.05 | 115.7 | 55.2 | (59.2 predicted, -4.9) |
| 2003.06 | 129.3 | 77.4 | (55.2 predicted, -4.0) |
| 2003.07 | 129.6 (1) | 128.2 (2) | (51.6 predicted, -3.6) |
1) Running average based on the daily 20:00 UTC observed solar flux value at 2800 MHz.
2) Unofficial, accumulated value based on the Boulder (NOAA/SEC) sunspot number. The official international sunspot number is typically
30-50% less.
This report has been prepared by Jan Alvestad. It is based partly on my own observations and interpretations, and partly on data from sources noted in solar links. All time references are to the UTC day. Comments and suggestions are always welcome.
| [DX-Listeners' Club] |