
Last update issued on July 24, 2003 at 04:15 UTC.
[Solar and geomagnetic data - last month (updated daily)]
[Solar wind and electron fluence charts (updated daily)]
[Solar cycles 21-23 (last update July 2, 2003)]
[Solar cycles 1-20]
[Graphical comparison of cycles 21, 22 and 23 (last update July 2, 2003)]
[Graphical comparison of cycles 2, 10, 13, 17, 20 and 23 (last update July 2, 2003)]
[Historical solar and geomagnetic data charts 1954-2003 (last update July 23, 2003)]
[Archived reports (last update July 21, 2003)]
The geomagnetic field was quiet to active on July 23. Solar wind speed ranged between 366 and 573 km/sec. A fairly weak disturbance was observed beginning at ACE at 14h UTC when the interplanetary magnetic field suddenly swung moderately southwards and remained weakly to moderately southwards to the end of the day. The arrival of this disturbance was associated with an increase in solar wind speed from approximately 400 km/sec to above 500 km/sec. A possible source could be the partial halo CME observed on July 19.
Solar flux measured at 20h UTC on 2.8 GHz was 144.1. The planetary A
index was 11 (STAR Ap - based on the mean of three hour interval ap indices: 12.3).
Three hour interval K indices: 22232334 (planetary), 22233424 (Boulder).
The background x-ray flux is at the class B6 level.
At midnight there were 9 spotted regions on the visible disk. Solar flare activity was low. A total of 10 C class events was recorded during the day.
Region 10409 was mostly unchanged and quiet. Flare: C1.2 at 03:00 and C1.5 at 04:13
(the source of this flare is uncertain as there was simultaneous activity in region 10417) UTC.
Region 10410 decayed further with a significant loss of penumbral area, particularly in the trailing positive polarity
area.
Region 10411 was quiet and stable.
Region 10412 decayed slowly and quietly.
Region 10414 was quiet and stable.
Region 10415 decayed slowly and quietly.
Region 10417 decayed and lost most of the penumbral area in the trailing spots section. The region is rotating over the
southwest limb. Flares: C1.2 at 00:59, C1.8 at 01:42, C1.9 at 04:35, C3.9/1F at 05:57, C2.3 at
11:37, C2.2 at 15:30 and C1.8 at 17:49 UTC.
Region 10418 decayed and had only a few tiny spots left late in the day. The region will likely become spotless today.
New region 10419 emerged in bright plage near the northeast limb. Flare: C1.0 at 09:23 UTC.
July 21-23: No potentially geoeffective CMEs observed.
Coronal hole history (since late October 2002)
Compare today's report with the situation one solar rotation ago: 28
days ago 27 days ago 26 days ago
A large coronal hole (CH49) in the southern hemisphere will likely be in a geoeffective position on July 24-31, a thin western extension could be in a geoeffective position on July 22.
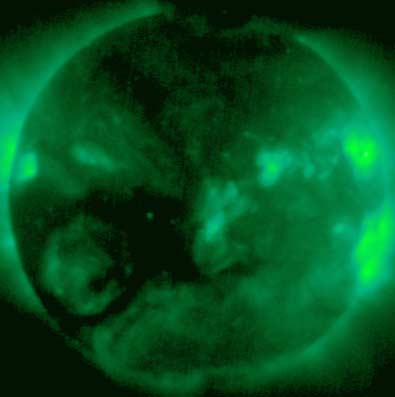
Processed GOES SXI coronal structure image at 22:24 UTC on July 23. Base SXI image courtesy of NOAA/SEC. The darkest areas on the solar disk are likely coronal holes.
The geomagnetic field is expected to be quiet to unsettled on July 23-25. A high speed stream from coronal hole CH49 will likely reach Earth on July 26 and cause unsettled to minor storm conditions until August 3.
Long distance medium wave (AM) band propagation along east-west paths over high and upper middle latitudes is poor. Propagation along north-south paths is poor to fair. [Trans Atlantic propagation conditions are currently monitored every night on 1470 kHz. Dominant station tonight: Radio Cristal del Uruguay with Radio Vibraci�n (Venezuela) noted occasionally. On 1510 kHz the Boston station came through for about one hour.]
| Coronal holes (1) | Coronal mass ejections (2) | M and X class flares (3) |
1) Effects from a coronal hole could reach Earth within the next 5 days.
2) Material from a CME is likely to impact Earth within 96 hours.
3) There is a possibility of either M or X class flares within the next 48 hours.
Green: 0-20% probability, Yellow: 20-60% probability, Red: 60-100% probability.

Compare to the previous day's image.
Data for all numbered solar regions according to the Solar Region Summary provided by NOAA/SEC. Comments are my own, as is the STAR spot count (spots observed at or inside a few hours before midnight) and data for regions not numbered by SEC or where SEC has observed no spots.
| Solar region | Date numbered | SEC spot count |
STAR spot count |
Location at midnight | Area | Classification | Comment |
|---|---|---|---|---|---|---|---|
| 10409 | 2003.07.13 | 8 | 12 | N15W61 | 0070 | CAO | beta-gamma |
| 10410 | 2003.07.13 | 21 | 22 | S13W66 | 0700 | EKI | |
| 10411 | 2003.07.15 | 1 | 2 | N14W40 | 0040 | HAX | |
| 10412 | 2003.07.16 | 5 | 6 | N16W73 | 0140 | DAO | |
| 10413 | 2003.07.16 | N20W45 | plage | ||||
| 10414 | 2003.07.17 | 1 | 2 | S03W08 | 0110 | HSX | |
| 10415 | 2003.07.19 | 6 | 5 | N12W26 | 0050 | CSO | |
| 10416 | 2003.07.20 | 3 | S07W82 | 0020 | BXO | spotless | |
| 10417 | 2003.07.20 | 15 | 16 | S22W76 | 0260 | EAI | beta-gamma |
| 10418 | 2003.07.20 | 2 | 2 | S05W51 | 0020 | HSX |
classification was AXX at midnight, area 0010 |
| 10419 | 2003.07.23 | 2 | 5 | N11E64 | 0010 | AXX |
classification was BXO at midnight |
| Total spot count: | 64 | 72 | |||||
| SSN: | 164 | 162 | |||||
| Month | Average solar flux at Earth |
International sunspot number | Smoothed sunspot number |
|---|---|---|---|
| 2000.04 | 184.2 | 125.5 | 120.8 cycle 23 sunspot max. |
| 2000.07 | 202.3 | 170.1 | 119.8 |
| 2001.12 | 235.1 | 132.2 | 114.6 (-0.9) |
| 2002.06 | 148.7 | 88.3 | 106.2 (-2.6) |
| 2002.07 | 173.5 | 99.6 | 102.7 (-3.5) |
| 2002.08 | 183.6 | 116.4 | 98.7 (-4.0) |
| 2002.09 | 175.8 | 109.6 | 94.6 (-4.1) |
| 2002.10 | 167.0 | 97.5 | 90.5 (-4.1) |
| 2002.11 | 168.7 | 95.5 | 85.2 (-5.3) |
| 2002.12 | 157.2 | 80.8 | 82.0 (-3.2) |
| 2003.01 | 144.0 | 79.7 | (79.7 predicted, -2.3) |
| 2003.02 | 124.5 | 46.0 | (74.7 predicted, -5.0) |
| 2003.03 | 131.4 | 61.1 | (69.0 predicted, -5.7) |
| 2003.04 | 126.4 | 60.0 | (64.1 predicted, -4.9) |
| 2003.05 | 115.7 | 55.2 | (59.2 predicted, -4.9) |
| 2003.06 | 129.3 | 77.4 | (55.2 predicted, -4.0) |
| 2003.07 | 135.3 (1) | 113.9 (2) | (51.6 predicted, -3.6) |
1) Running average based on the daily 20:00 UTC observed solar flux value at 2800 MHz.
2) Unofficial, accumulated value based on the Boulder (NOAA/SEC) sunspot number. The official international sunspot number is typically
30-50% less.
This report has been prepared by Jan Alvestad. It is based partly on my own observations and interpretations, and partly on data from sources noted in solar links. All time references are to the UTC day. Comments and suggestions are always welcome.
| [DX-Listeners' Club] |