
Last update issued on July 19, 2003 at 05:10 UTC. Minor update posted at 19:21 UTC.
[Solar and geomagnetic data - last month (updated daily)]
[Solar wind and electron fluence charts (updated daily)]
[Solar cycles 21-23 (last update July 2, 2003)]
[Solar cycles 1-20]
[Graphical comparison of cycles 21, 22 and 23 (last update July 2, 2003)]
[Graphical comparison of cycles 2, 10, 13, 17, 20 and 23 (last update July 2, 2003)]
[Historical solar and geomagnetic data charts 1954-2003 (last update April 13, 2003)]
[Archived reports (last update July 11, 2003)]
The geomagnetic field was quiet to active on July 18. Solar wind speed ranged between 474 and 723 km/sec. A quick decrease in wind speed was observed at ACE between 07 and 09h UTC, then the solar wind became gradually more dominated by the coronal flow from the easternmost geoeffective part of CH48. This caused an increase in geomagnetic disturbance levels towards the end of the day.
Solar flux measured at 20h UTC on 2.8 GHz was 139.7. The planetary A
index was 14 (STAR Ap - based on the mean of three hour interval ap indices: 14.9).
Three hour interval K indices: 33222334 (planetary), 43223334 (Boulder).
The background x-ray flux is at the class B5 level.
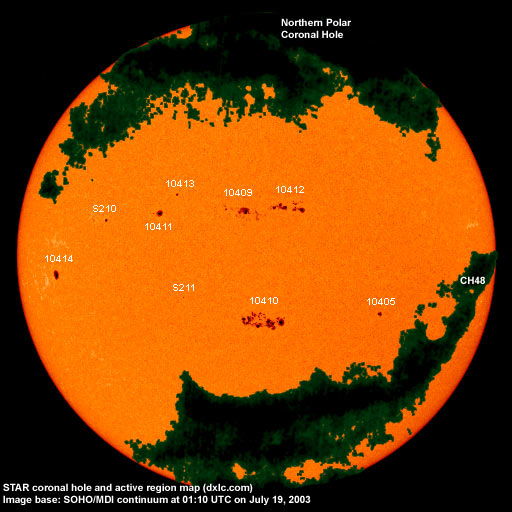
At midnight there were 9 spotted regions on the visible disk. Solar flare activity was low. A total of 10 C class events was recorded during the day.
Region 10405 was quiet and stable.
Region 10409 lost some leading and trailing spots while the dominant intermediate spot section was mostly unchanged. The
region currently has a fairly simple layout but could contribute to a large flare if neighboring region 10412 continues to
develop.
Region 10410 developed very quickly and has become a large region capable of producing major flares, even X class flares.
There is a strengthening magnetic delta structure in the southern central part of the region where a negative polarity spot is
nearly surrounded by positive polarity spots. Major flares are possible. Flares: C5.4 at
00:05, C2.0 at 04:19, C1.2 at 07:42, C2.1 at 14:50, C1.0 at 17:36, C4.8 at 18:28 and C1.4 at 23:24 UTC.
Region 10411 developed a small trailing spot and was otherwise mostly unchanged..
Region 10412 developed quickly, particularly in the trailing spot section which has a magnetic delta structure. M class flares
are possible. Flares: C1.3 at 13:50, C2.4 at 19:54, C1.8 at 22:43 UTC.
Region 10413 was quiet and stable.
Region 10414 was quiet and stable.
Spotted regions not numbered by NOAA/SEC:
[S210] A new region emerged early on July 18 in the northeast quadrant. Location at midnight: N13E41.
[S211] A new region emerged in the southeast quadrant early on July 18. Location at midnight: S06E17.
A region located at N03E32 at midnight emerged with a few spots during the morning, however, the spots quickly disappeared.
Comment added at 19:21 UTC on July 19: Solar activity is increasing with 9 small C flares recorded just between 14 and 19h UTC. Region 10410 has continued to grow impressively and has a strong magnetic delta structure in the central southern section. An X class flare could occur anytime during the next 24 hours. Region 10412 has developed quickly as well. Interestingly a third region has developed a magnetic delta structure, region S210 is developing quickly. Two new regions (increasing the total number of spotted regions to 11) have emerged, both in the southwest quadrant. Of those the new region southwest of region 10410 appears to be the most interesting one.
July 16 and 18: No potentially geoeffective CMEs observed.
July 17: A faint halo CME was associated with a C9 flare in region 10412. The CME was observed in LASCO C2 images after 09h UTC.
Coronal hole history (since late October 2002)
Compare today's report with the situation one solar rotation ago: 28
days ago 27 days ago 26 days ago
A recurrent coronal hole (CH48) in the northern hemisphere and with a large trans equatorial extension was in a geoeffective position on July 12-16.
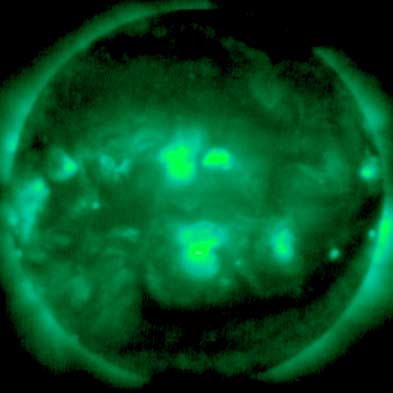
Processed GOES SXI coronal structure image at 00:58 UTC on July 19. The darkest areas on the solar disk are likely coronal holes.
The geomagnetic field is expected to be quiet to active, possibly with minor storm intervals, on July 19 due to a high speed stream from coronal hole CH48. A CME observed on July 17 could reach Earth early on July 20 and cause unsettled to minor storm conditions. Quiet to unsettled is expected for July 21-23 unless there is a major flare in either of regions 10410 and 10412.
Long distance medium wave (AM) band propagation along east-west paths over high and upper middle latitudes is very poor. Propagation along north-south paths is fair. [Trans Atlantic propagation conditions are currently monitored every night on 1470 kHz. Dominant station tonight: Radio Cristal del Uruguay.]
| Coronal holes (1) | Coronal mass ejections (2) | M and X class flares (3) |
1) Effects from a coronal hole could reach Earth within the next 5 days.
2) Material from a CME is likely to impact Earth within 96 hours.
3) There is a possibility of either M or X class flares within the next 48 hours.
Green: 0-20% probability, Yellow: 20-60% probability, Red: 60-100% probability.
Compare to the previous day's image.
Data for all numbered solar regions according to the Solar Region Summary provided by NOAA/SEC. Comments are my own, as is the STAR spot count (spots observed at or inside a few hours before midnight) and data for regions not numbered by SEC or where SEC has observed no spots.
| Solar region | Date numbered | SEC spot count |
STAR spot count |
Location at midnight | Area | Classification | Comment |
|---|---|---|---|---|---|---|---|
| 10404 | 2003.07.07 | S11W80 | plage | ||||
| 10405 | 2003.07.11 | 4 | 2 | S10W29 | 0040 | HSX | |
| 10407 | 2003.07.11 | N10W62 | plage | ||||
| 10408 | 2003.07.13 | 1 | N13W45 | 0010 | HSX | spotless | |
| 10409 | 2003.07.13 | 36 | 29 | N15E05 | 0160 | EAO | |
| 10410 | 2003.07.13 | 42 | 65 | S11W01 | 0220 | DAI |
beta-gamma-delta
classification was EKC at midnight, area 0700 |
| 10411 | 2003.07.15 | 1 | 2 | N14E26 | 0060 | HAX | |
| 10412 | 2003.07.16 | 27 | 31 | N17W06 | 0100 | DAI |
beta-gamma-delta area was 0250 at midnight |
| 10413 | 2003.07.16 | 1 | 1 | N20E22 | 0010 | AXX |
classification was HSX at midnight, area 0020 |
| 10414 | 2003.07.17 | 1 | 1 | S02E58 | 0120 | HAX | |
| S208 | emerged on 2003.07.15 |
N11W55 | plage | ||||
| S210 | emerged on 2003.07.18 |
4 | N13E41 | 0030 | CSO | ||
| S211 | emerged on 2003.07.18 |
1 | S06E17 | 0000 | AXX | ||
| Total spot count: | 113 | 136 | |||||
| SSN: | 193 | 226 | |||||
| Month | Average solar flux at Earth |
International sunspot number | Smoothed sunspot number |
|---|---|---|---|
| 2000.04 | 184.2 | 125.5 | 120.8 cycle 23 sunspot max. |
| 2000.07 | 202.3 | 170.1 | 119.8 |
| 2001.12 | 235.1 | 132.2 | 114.6 (-0.9) |
| 2002.06 | 148.7 | 88.3 | 106.2 (-2.6) |
| 2002.07 | 173.5 | 99.6 | 102.7 (-3.5) |
| 2002.08 | 183.6 | 116.4 | 98.7 (-4.0) |
| 2002.09 | 175.8 | 109.6 | 94.6 (-4.1) |
| 2002.10 | 167.0 | 97.5 | 90.5 (-4.1) |
| 2002.11 | 168.7 | 95.5 | 85.2 (-5.3) |
| 2002.12 | 157.2 | 80.8 | 82.0 (-3.2) |
| 2003.01 | 144.0 | 79.7 | (79.7 predicted, -2.3) |
| 2003.02 | 124.5 | 46.0 | (74.7 predicted, -5.0) |
| 2003.03 | 131.4 | 61.1 | (69.0 predicted, -5.7) |
| 2003.04 | 126.4 | 60.0 | (64.1 predicted, -4.9) |
| 2003.05 | 115.7 | 55.2 | (59.2 predicted, -4.9) |
| 2003.06 | 129.3 | 77.4 | (55.2 predicted, -4.0) |
| 2003.07 | 131.0 (1) | 82.1 (2) | (51.6 predicted, -3.6) |
1) Running average based on the daily 20:00 UTC observed solar flux value at 2800 MHz.
2) Unofficial, accumulated value based on the Boulder (NOAA/SEC) sunspot number. The official international sunspot number is typically
30-50% less.
This report has been prepared by Jan Alvestad. It is based partly on my own observations and interpretations, and partly on data from sources noted in solar links. All time references are to the UTC day. Comments and suggestions are always welcome.
| [DX-Listeners' Club] |