
Last update issued on July 17, 2003 at 02:20 UTC.
[Solar and geomagnetic data - last month (updated daily)]
[Solar wind and electron fluence charts (updated daily)]
[Solar cycles 21-23 (last update July 2, 2003)]
[Solar cycles 1-20]
[Graphical comparison of cycles 21, 22 and 23 (last update July 2, 2003)]
[Graphical comparison of cycles 2, 10, 13, 17, 20 and 23 (last update July 2, 2003)]
[Historical solar and geomagnetic data charts 1954-2003 (last update April 13, 2003)]
[Archived reports (last update July 11, 2003)]
The geomagnetic field was active to major storm on July 16. Solar wind speed ranged between 531 and 708 km/sec, mostly under the influence of a high speed stream from coronal hole CH48. There may have been other sources contributing to the disturbance as well, particularly between 06 and 19h UTC when ACE solar wind data was somewhat atypical for a high speed stream.
Solar flux measured at 20h UTC on 2.8 GHz was 133.1. The planetary A
index was 48 (STAR Ap - based on the mean of three hour interval ap indices: 52.5).
Three hour interval K indices: 45666445 (planetary), 44565445 (Boulder).
The background x-ray flux is at the class B3 level.
At midnight there were 10 spotted regions on the visible disk. Solar flare activity was low. A total of 4 C class events was recorded during the day.
Region 10401 decayed further and will soon rotate over the southwest limb..
Region 10405 lost most of its trailing spots and the leading penumbra became symmetrical.
Region 10407 decayed further and could become spotless today.
Region 10408 was quiet and stable.
Region 10409 was quiet and decayed significantly losing penumbral area, particularly in the trailing spot section. While
the region has simplified there is still a chance of an isolated M class flare.
Region 10410 developed quickly and at one point had a magnetic delta structure. A minor M class flare is possible. Flares:
C1.3 at 12:23, C1.2 at 14:08, C1.2 at 16:10 and C2.9 at 16:35 UTC.
Region 10411 was quiet and stable.
New region 10412 emerged west of region 10409 on July 13 and was numbered by SEC 3 days later. The region developed slowly
on July 16 and has mixed polarities.
New region 10413 rotated into view at the northeast limb on July 14 and was numbered by SEC 2 days afterwards.
Spotted regions not numbered by SEC:
[S209] A new region rotated partly into view at the southeast limb on July 16. Location at midnight: S02E83.
July 14-16: No potentially geoeffective CMEs observed.
Coronal hole history (since late October 2002)
Compare today's report with the situation one solar rotation ago: 28
days ago 27 days ago 26 days ago
A recurrent coronal hole (CH48) in the northern hemisphere and with a large trans equatorial extension was in a geoeffective position on July 12-16.
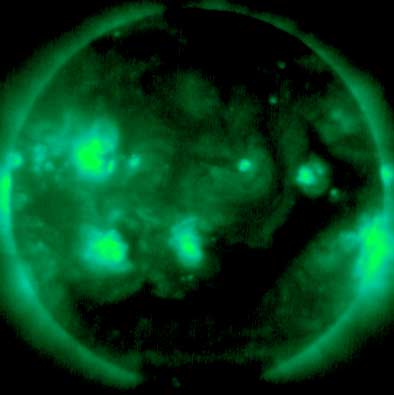
Processed GOES SXI coronal structure image at 20:26 UTC on July 16. The darkest areas on the solar disk are likely coronal holes.
The geomagnetic field is expected to be unsettled to minor storm on July 17-18 and quiet to active on July 19, mainly due to a high speed stream from coronal hole CH48.
Long distance medium wave (AM) band propagation along east-west paths over high and upper middle latitudes is useless. Propagation along north-south paths is fair. [Trans Atlantic propagation conditions are currently monitored every night on 1470 kHz. Dominant station tonight: none, several stations from Brazil noted.]
| Coronal holes (1) | Coronal mass ejections (2) | M and X class flares (3) |
1) Effects from a coronal hole could reach Earth within the next 5 days.
2) Material from a CME is likely to impact Earth within 96 hours.
3) There is a possibility of either M or X class flares within the next 48 hours.
Green: 0-20% probability, Yellow: 20-60% probability, Red: 60-100% probability.

Compare to the previous day's image.
Data for all numbered solar regions according to the Solar Region Summary provided by NOAA/SEC. Comments are my own, as is the STAR spot count (spots observed at or inside a few hours before midnight) and data for regions not numbered by SEC or where SEC has observed no spots.
| Solar region | Date numbered | SEC spot count |
STAR spot count |
Location at midnight | Area | Classification | Comment |
|---|---|---|---|---|---|---|---|
| 10401 | 2003.07.06 | 1 | 3 | S09W73 | 0040 | HSX |
classification was HAX at midnight |
| 10403 | 2003.07.07 | S16W65 | plage | ||||
| 10404 | 2003.07.07 | S11W54 | plage | ||||
| 10405 | 2003.07.11 | 5 | 6 | S11E01 | 0050 | CSO | |
| 10406 | 2003.07.11 | 1 | S17W78 | 0010 | AXX | now spotless | |
| 10407 | 2003.07.11 | 3 | 1 | N10W36 | 0010 | CRO |
classification was AXX at midnight |
| 10408 | 2003.07.13 | 1 | 4 | N14W17 | 0010 | HRX |
classification was CSO at midnight |
| 10409 | 2003.07.13 | 34 | 39 | N16E30 | 0300 | FKI | |
| 10410 | 2003.07.13 | 8 | 15 | S12E28 | 0070 | DSO | beta-gamma |
| 10411 | 2003.07.15 | 2 | 1 | N15E53 | 0060 | HSX | |
| 10412 | 2003.07.16 | 8 | 11 | N16E19 | 0030 | CSO |
beta-gamma formerly region S204 classification was DAO at midnight |
| 10413 | 2003.07.16 | 1 | 1 | N18E49 | 0030 | HSX | formerly region S206 |
| S208 | emerged on 2003.07.15 |
N11W42 | now spotless | ||||
| S209 | visible on 2003.07.16 |
1 | S02E83 | 0080 | HSX | ||
| Total spot count: | 64 | 82 | |||||
| SSN: | 164 | 182 | |||||
| Month | Average solar flux at Earth |
International sunspot number | Smoothed sunspot number |
|---|---|---|---|
| 2000.04 | 184.2 | 125.5 | 120.8 cycle 23 sunspot max. |
| 2000.07 | 202.3 | 170.1 | 119.8 |
| 2001.12 | 235.1 | 132.2 | 114.6 (-0.9) |
| 2002.06 | 148.7 | 88.3 | 106.2 (-2.6) |
| 2002.07 | 173.5 | 99.6 | 102.7 (-3.5) |
| 2002.08 | 183.6 | 116.4 | 98.7 (-4.0) |
| 2002.09 | 175.8 | 109.6 | 94.6 (-4.1) |
| 2002.10 | 167.0 | 97.5 | 90.5 (-4.1) |
| 2002.11 | 168.7 | 95.5 | 85.2 (-5.3) |
| 2002.12 | 157.2 | 80.8 | 82.0 (-3.2) |
| 2003.01 | 144.0 | 79.7 | (79.7 predicted, -2.3) |
| 2003.02 | 124.5 | 46.0 | (74.7 predicted, -5.0) |
| 2003.03 | 131.4 | 61.1 | (69.0 predicted, -5.7) |
| 2003.04 | 126.4 | 60.0 | (64.1 predicted, -4.9) |
| 2003.05 | 115.7 | 55.2 | (59.2 predicted, -4.9) |
| 2003.06 | 129.3 | 77.4 | (55.2 predicted, -4.0) |
| 2003.07 | 129.9 (1) | 69.8 (2) | (51.6 predicted, -3.6) |
1) Running average based on the daily 20:00 UTC observed solar flux value at 2800 MHz.
2) Unofficial, accumulated value based on the Boulder (NOAA/SEC) sunspot number. The official international sunspot number is typically
30-50% less.
This report has been prepared by Jan Alvestad. It is based partly on my own observations and interpretations, and partly on data from sources noted in solar links. All time references are to the UTC day. Comments and suggestions are always welcome.
| [DX-Listeners' Club] |