
Last update issued on July 12, 2003 at 04:15 UTC.
[Solar and geomagnetic data - last month (updated daily)]
[Solar wind and electron fluence charts (updated daily)]
[Solar cycles 21-23 (last update July 2, 2003)]
[Solar cycles 1-20]
[Graphical comparison of cycles 21, 22 and 23 (last update July 2, 2003)]
[Graphical comparison of cycles 2, 10, 13, 17, 20 and 23 (last update July 2, 2003)]
[Historical solar and geomagnetic data charts 1954-2003 (last update April 13, 2003)]
[Archived reports (last update July 11, 2003)]
The geomagnetic field was unsettled to major storm on July 11. Solar wind speed ranged between 347 and 706 km/sec. The high speed stream from coronal hole CH47 arrived at ACE at about 13h UTC. Until about 18h UTC the solar wind disturbance was a combination of the early effects from the coronal hole flow and the prior strong disturbance. The low speed disturbance which dominated the first half of the day intensified gradually and peaked between 08 and 09h UTC. Taking into account the low solar wind speed and events over the recent days, the most likely source of the disturbance may have been a large filament eruption (and CME) near the northwest limb, or an M flare with an associated CME in region 10400, both events occurred on July 6.
Solar flux measured at 20h UTC on 2.8 GHz was 122.0. The planetary A
index was 46 (STAR Ap - based on the mean of three hour interval ap indices: 47.4).
Three hour interval K indices: 35655455 (planetary), 25654535 (Boulder).
The background x-ray flux is at the class B5 level.
At midnight there were 7 spotted regions on the visible disk. Solar flare activity was low. A total of 6 C class events was recorded during the day. A C1.2 flare at 19:26 UTC had its origin behind the southeast limb.
Region 10397 behind the northwest limb continued being active and produced a few flares. Flares:
C1.9 at 04:27, C1.1 at 10:39, a C1.5 long duration event peaking at 12:14 and C1.0 at 13:50 UTC.
Region 10400 continued to decay quickly and could become spotless today if the current rate of decay persists. Only a few
small spots were visible late in the day.
Region 10401 began to decay during the latter half of the day. The region is magnetically simple and further decay is
likely. Flares: A long duration C2.9 event peaking at 07:39 UTC. This event was associated
with an erupting filament as well.
Region 10403 was quiet and stable
Region 10404 decayed further and could soon become spotless.
New region 10405 rotated into view at the southeast limb on July 10 and was numbered the next day by SEC.
New region 10406 emerged in the southwest quadrant.
New region 10407 emerged in the northeast quadrant.
An active region will soon rotate into view at the northeast limb, this region produced a C3 flare early on July 12.
July 9-10: No LASCO images available due to a problem with the SOHO high gain antenna.
July 11: The long duration C3 event in the morning appears to have been associated with a slow moving CME. While best defined over the north pole, material outflow was observed over both the southeast and southwest limbs. The CME could reach Earth on July 14.
Coronal hole history (since late October 2002)
Compare today's report with the situation one solar rotation ago: 28
days ago 27 days ago 26 days ago
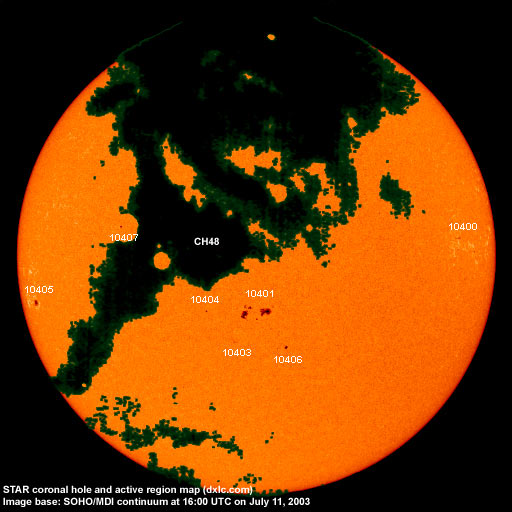
A recurrent trans equatorial coronal hole (CH47) was in a geoeffective position on July 8-9, this coronal hole appeared to be decaying on July 9 and 10. Another recurrent and developing coronal hole (CH48) in the northern hemisphere and with a significant trans equatorial extension will rotate into a geoeffective position on July 12-14.

Processed GOES SXI coronal structure image at 20:56 UTC on July 11. The darkest areas on the solar disk are likely coronal holes.
The geomagnetic field is expected to be unsettled to major storm on July 12-13 due to a high speed stream from coronal hole CH47. The high speed stream from coronal hole CH48 will cause unsettled to minor storm conditions on July 15-17.
Long distance medium wave (AM) band propagation along east-west paths over high and upper middle latitudes is useless. Propagation along north-south paths is poor to very poor. [Trans Atlantic propagation conditions are currently monitored every night on 1470 kHz. Dominant station tonight: Radio Cristal del Uruguay with a weak signal.]
| Coronal holes (1) | Coronal mass ejections (2) | M and X class flares (3) |
1) Effects from a coronal hole could reach Earth within the next 5 days.
2) Material from a CME is likely to impact Earth within 96 hours.
3) There is a possibility of either M or X class flares within the next 48 hours.
Green: 0-20% probability, Yellow: 20-60% probability, Red: 60-100% probability.
Compare to the previous day's image.
Data for all numbered solar regions according to the Solar Region Summary provided by NOAA/SEC. Comments are my own, as is the STAR spot count (spots observed at or inside a few hours before midnight) and data for regions not numbered by SEC or where SEC has observed no spots.
| Solar region | Date numbered | SEC spot count |
STAR spot count |
Location at midnight | Area | Classification | Comment |
|---|---|---|---|---|---|---|---|
| 10398 | 2003.06.30 | N03W79 | plage | ||||
| 10400 | 2003.07.01 | 12 | 5 | N06W65 | 0110 | EAI |
classification was CRO at midnight, area 0020 |
| 10401 | 2003.07.06 | 21 | 20 | S09W05 | 0210 | DAO | |
| 10402 | 2003.07.07 | 3 | S12W96 | 0080 | HAX |
rotated out of view early in the day |
|
| 10403 | 2003.07.07 | 4 | 5 | S16W00 | 0010 | AXX |
classification was BXO at midnight |
| 10404 | 2003.07.07 | 1 | 1 | S10E08 | 0020 | HSX | |
| 10405 | 2003.07.11 | 2 | 2 | S10E66 | 0080 | HAX |
formerly region S200 classification was CAO at midnight |
| 10406 | 2003.07.11 | 2 | 5 | S19W11 | 0020 | HSX |
classification was CAO at midnight |
| 10407 | 2003.07.11 | 2 | 3 | N09E31 | 0010 | HSX |
classification was DSO at midnight |
| S199 | emerged on 2003.07.09 |
S07W58 | plage | ||||
| Total spot count: | 47 | 41 | |||||
| SSN: | 127 | 111 | |||||
| Month | Average solar flux at Earth |
International sunspot number | Smoothed sunspot number |
|---|---|---|---|
| 2000.04 | 184.2 | 125.5 | 120.8 cycle 23 sunspot max. |
| 2000.07 | 202.3 | 170.1 | 119.8 |
| 2001.12 | 235.1 | 132.2 | 114.6 (-0.9) |
| 2002.06 | 148.7 | 88.3 | 106.2 (-2.6) |
| 2002.07 | 173.5 | 99.6 | 102.7 (-3.5) |
| 2002.08 | 183.6 | 116.4 | 98.7 (-4.0) |
| 2002.09 | 175.8 | 109.6 | 94.6 (-4.1) |
| 2002.10 | 167.0 | 97.5 | 90.5 (-4.1) |
| 2002.11 | 168.7 | 95.5 | 85.2 (-5.3) |
| 2002.12 | 157.2 | 80.8 | 82.0 (-3.2) |
| 2003.01 | 144.0 | 79.7 | (79.7 predicted, -2.3) |
| 2003.02 | 124.5 | 46.0 | (74.7 predicted, -5.0) |
| 2003.03 | 131.4 | 61.1 | (69.0 predicted, -5.7) |
| 2003.04 | 126.4 | 60.0 | (64.1 predicted, -4.9) |
| 2003.05 | 115.7 | 55.2 | (59.2 predicted, -4.9) |
| 2003.06 | 129.3 | 77.4 | (55.2 predicted, -4.0) |
| 2003.07 | 131.4 (1) | 46.7 (2) | (51.6 predicted, -3.6) |
1) Running average based on the daily 20:00 UTC observed solar flux value at 2800 MHz.
2) Unofficial, accumulated value based on the Boulder (NOAA/SEC) sunspot number. The official international sunspot number is typically
30-50% less.
This report has been prepared by Jan Alvestad. It is based partly on my own observations and interpretations, and partly on data from sources noted in solar links. All time references are to the UTC day. Comments and suggestions are always welcome.
| [DX-Listeners' Club] |