
Last update issued on July 8, 2003 at 03:40 UTC.
[Solar and geomagnetic data - last month (updated daily)]
[Solar wind and electron fluence charts (updated daily)]
[Solar cycles 21-23 (last update July 2, 2003)]
[Solar cycles 1-20]
[Graphical comparison of cycles 21, 22 and 23 (last update July 2, 2003)]
[Graphical comparison of cycles 2, 10, 13, 17, 20 and 23 (last update July 2, 2003)]
[Historical solar and geomagnetic data charts 1954-2003 (last update April 13, 2003)]
[Archived reports (last update July 2, 2003)]
The geomagnetic field was quiet to active on July 7. Solar wind speed ranged between 457 and 738 km/sec, generally decreasing all day.
Solar flux measured at 20h UTC on 2.8 GHz was 133.3. The planetary A
index was 14 (STAR Ap - based on the mean of three hour interval ap indices: 14.6).
Three hour interval K indices: 33433222 (planetary), 33433423 (Boulder). The Boulder K indices are higher than
expected and corresponds to an A index of 17. The comparable mid latitude magnetometer at Fredericksburg recorded significantly
lower values and a corresponding A index of 9 for the day.
The background x-ray flux is at the class B3 level.
At midnight there were 6 spotted regions on the visible disk. Solar flare activity was low. A single C class event was recorded during the day.
Region 10397 decayed and lost its magnetic delta structure. The huge leading penumbra is about to split into two
smaller penumbrae. An M class flare is still a possibility. Flare: C2.3 at 19:14 UTC.
Region 10400 decayed in the leading spot section. Two magnetic delta structures formed in the trailing penumbrae. A
minor M class flare is possible.
Region 10401 developed slowly and quietly.
New region 10402 emerged in the southwest quadrant.
New region 10403 emerged in the southeast quadrant.
New region 10404 rotated into view at the southeast limb on July 6 and was numbered by SEC the next day.
July 5-7: Some LASCO images available. There is a problem with the SOHO high gain antenna. Until the high gain antenna is in a favorable position starting from mid July, SOHO science data will be transmitted over a low gain antenna and only a limited amount of data will be available.
July 6: A fairly large filament eruption was observed beginning at 03:00 UTC in region 10397 and stretching east northeastwards across the central meridian. The CME associated with this event could be geoeffective and reach Earth on July 8 or 9.
Coronal hole history (since late October 2002)
Compare today's report with the situation one solar rotation ago: 28
days ago 27 days ago 26 days ago
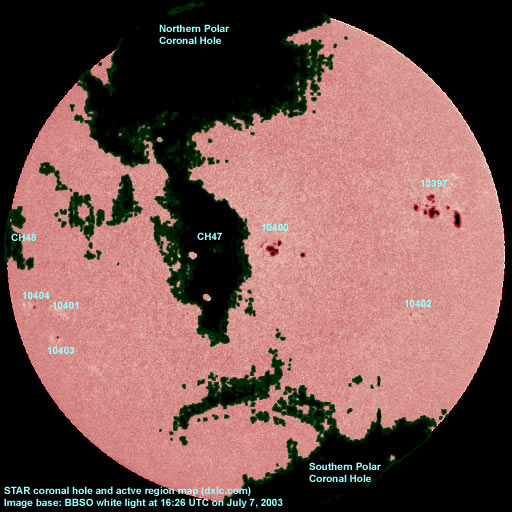
A recurrent trans equatorial coronal hole (CH47) - possibly an extension of the northern polar coronal hole - will be rotating into a geoeffective position on July 8-9. Another coronal hole (CH48) mainly in the northern hemisphere but with a trans equatorial extension, will rotate into a geoeffective position on July 13-14.
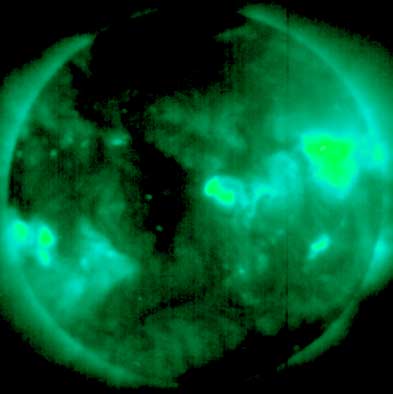
Processed GOES SXI coronal structure image at 19:56 UTC on July 7. The darkest areas on the solar disk are likely coronal holes.
The geomagnetic field is expected to be quiet to unsettled on July 8. A CME associated with a filament eruption early on July 6 could reach Earth on July 9 and cause unsettled to active conditions. A high speed stream from coronal hole CH47 will cause unsettled to active conditions on July 11-13.
Long distance medium wave (AM) band propagation along east-west paths over high and upper middle latitudes is very poor. Propagation along north-south paths is poor to fair. [Trans Atlantic propagation conditions are currently monitored every night on 1470 kHz. Dominant station tonight: Radio Cristal del Uruguay.]
| Coronal holes (1) | Coronal mass ejections (2) | M and X class flares (3) |
1) Effects from a coronal hole could reach Earth within the next 5 days.
2) Material from a CME is likely to impact Earth within 96 hours.
3) There is a possibility of either M or X class flares within the next 48 hours.
Green: 0-20% probability, Yellow: 20-60% probability, Red: 60-100% probability.
Compare to the previous day's image.
Data for all numbered solar regions according to the Solar Region Summary provided by NOAA/SEC. Comments are my own, as is the STAR spot count (spots observed at or inside a few hours before midnight) and data for regions not numbered by SEC or where SEC has observed no spots.
| Solar region | Date numbered | SEC spot count |
STAR spot count |
Location at midnight | Area | Classification | Comment |
|---|---|---|---|---|---|---|---|
| 10395 | 2003.06.26 | N10W83 | plage | ||||
| 10397 | 2003.06.27 | 38 | 37 | N12W52 | 0810 | FKC | beta-gamma |
| 10398 | 2003.06.30 | N03W27 | |||||
| 10399 | 2003.06.30 | N14W40 | plage | ||||
| 10400 | 2003.07.01 | 22 | 27 | N05W10 | 0210 | EAI |
beta-gamma-delta area was 0300 at midnight |
| 10401 | 2003.07.06 | 6 | 6 | S10E52 | 0030 | CSO |
classification was BXO at midnight |
| 10402 | 2003.07.07 | 5 | 5 | S12W44 | 0020 | CSO |
classification was CRO at midnight |
| 10403 | 2003.07.07 | 3 | 4 | S18E54 | 0050 | DSO |
classification was CSO at midnight |
| 10404 | 2003.07.07 | 6 | 5 | S10E64 | 0060 | DSO |
formerly region S198 classification was CSO at midnight |
| Total spot count: | 80 | 84 | |||||
| SSN: | 140 | 144 | |||||
| Month | Average solar flux at Earth |
International sunspot number | Smoothed sunspot number |
|---|---|---|---|
| 2000.04 | 184.2 | 125.5 | 120.8 cycle 23 sunspot max. |
| 2000.07 | 202.3 | 170.1 | 119.8 |
| 2001.12 | 235.1 | 132.2 | 114.6 (-0.9) |
| 2002.06 | 148.7 | 88.3 | 106.2 (-2.6) |
| 2002.07 | 173.5 | 99.6 | 102.7 (-3.5) |
| 2002.08 | 183.6 | 116.4 | 98.7 (-4.0) |
| 2002.09 | 175.8 | 109.6 | 94.6 (-4.1) |
| 2002.10 | 167.0 | 97.5 | 90.5 (-4.1) |
| 2002.11 | 168.7 | 95.5 | 85.2 (-5.3) |
| 2002.12 | 157.2 | 80.8 | 82.0 (-3.2) |
| 2003.01 | 144.0 | 79.7 | (79.7 predicted, -2.3) |
| 2003.02 | 124.5 | 46.0 | (74.7 predicted, -5.0) |
| 2003.03 | 131.4 | 61.1 | (69.0 predicted, -5.7) |
| 2003.04 | 126.4 | 60.0 | (64.1 predicted, -4.9) |
| 2003.05 | 115.7 | 55.2 | (59.2 predicted, -4.9) |
| 2003.06 | 129.3 | 77.4 | (55.2 predicted, -4.0) |
| 2003.07 | 134.7 (1) | 29.4 (2) | (51.6 predicted, -3.6) |
1) Running average based on the daily 20:00 UTC observed solar flux value at 2800 MHz.
2) Unofficial, accumulated value based on the Boulder (NOAA/SEC) sunspot number. The official international sunspot number is typically
30-50% less.
This report has been prepared by Jan Alvestad. It is based partly on my own observations and interpretations, and partly on data from sources noted in solar links. All time references are to the UTC day. Comments and suggestions are always welcome.
| [DX-Listeners' Club] |