
Last update issued on July 2, 2003 at 03:15 UTC.
[Solar and geomagnetic data - last month (updated daily)]
[Solar wind and electron fluence charts (updated daily)]
[Solar cycles 21-23 (last update July 2, 2003)]
[Solar cycles 1-20]
[Graphical comparison of cycles 21, 22 and 23 (last update July 2, 2003)]
[Graphical comparison of cycles 2, 10, 13, 17, 20 and 23 (last update July 2, 2003)]
[Historical solar and geomagnetic data charts 1954-2003 (last update April 13, 2003)]
[Archived reports (last update July 2, 2003)]
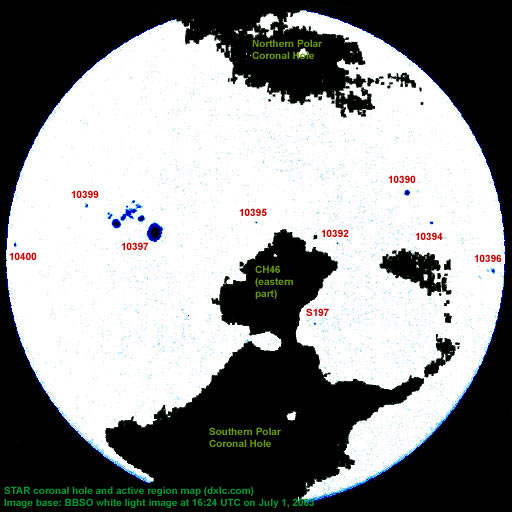
The geomagnetic field was quiet to active on July 1. Solar wind speed ranged between 538 and 735 km/sec under the weakening influence of a high speed stream from coronal hole CH46.
Solar flux measured at 20h UTC on 2.8 GHz was 131.1. The planetary A
index was 13 (STAR Ap - based on the mean of three hour interval ap indices: 14.1).
Three hour interval K indices: 34323333 (planetary), 24333333 (Boulder).
The background x-ray flux is at the class B3 level.
At midnight there were 9 spotted regions on the visible disk. Solar flare activity was low. A total of 4 C class events was recorded during the day.
Region 10390 decayed slowly and quietly.
Region 10392 was quiet and stable.
Region 10394 decayed slowly and quietly.
Region 10395 was quiet and stable.
Region 10396 decayed quickly and was quiet.
Region 10397 developed slowly in the trailing spot section and still has a magnetic delta structure. M class
flaring is possible. Flares: C2.3 at 13:43, C1.4 at 18:02, C1.1 at 19:02 and C1.0 at 20:29 UTC.
Region 10399 developed slowly adding several small spots.
New region 10400 rotated into view at the northeast limb on June 30 and was numbered the next day by SEC.
Spotted regions not yet numbered by SEC:
[S197] A new region emerged in the southwest quadrant on July 1. Location at midnight: S13W15.
June 29-July 1: No LASCO images available. There is a serious problem with the SOHO high gain antenna. New LASCO images and nearly all other SOHO data is expected to be unavailable until about July 14.
Coronal hole history (since late October 2002)
Compare today's report with the situation one solar rotation ago: 28
days ago 27 days ago 26 days ago
A huge, recurrent coronal hole (CH46) mainly in the southern hemisphere and with a large leading trans equatorial extension will rotate into a geoeffective position from late on June 24 until July 2. The trans equatorial extension has become much larger over the last solar rotation.

Processed GOES SXI coronal structure image at 19:24 UTC on July 1. The darkest areas on the solar disk are likely coronal holes.
The geomagnetic field is expected to be quiet to active on July 2-5 with a possibility of occasional minor storm intervals due to a high speed stream from coronal hole CH46.
Long distance medium wave (AM) band propagation along east-west paths over high and upper middle latitudes is poor to very poor. Propagation along north-south paths is poor to fair. [Trans Atlantic propagation conditions are currently monitored every night on 1470 kHz. Dominant station tonight: Radio Cristal del Uruguay with a fairly weak signal.]
| Coronal holes (1) | Coronal mass ejections (2) | M and X class flares (3) |
1) Effects from a coronal hole could reach Earth within the next 5 days.
2) Material from a CME is likely to impact Earth within 96 hours.
3) There is a possibility of either M or X class flares within the next 48 hours.
Green: 0-20% probability, Yellow: 20-60% probability, Red: 60-100% probability.
Compare to the previous day's image.
Data for all numbered solar regions according to the Solar Region Summary provided by NOAA/SEC. Comments are my own, as is the STAR spot count (spots observed at or inside a few hours before midnight) and data for regions not numbered by SEC or where SEC has observed no spots.
| Solar region | Date numbered | SEC spot count |
STAR spot count |
Location at midnight | Area | Classification | Comment |
|---|---|---|---|---|---|---|---|
| 10390 | 2003.06.22 | 1 | 1 | N16W43 | 0070 | HSX | |
| 10392 | 2003.06.24 | 2 | 2 | N06W26 | 0010 | BXO |
classification was AXX at midnight, only positive polarity spots |
| 10393 | 2003.06.24 | S13W27 | plage | ||||
| 10394 | 2003.06.26 | 2 | 3 | N08W49 | 0020 | HSX | |
| 10395 | 2003.06.26 | 2 | 2 | N11W04 | 0010 | BXO |
classification was AXX at midnight |
| 10396 | 2003.06.27 | 8 | 9 | S05W69 | 0130 | DSO | |
| 10397 | 2003.06.27 | 28 | 43 | N12E26 | 0770 | EKI | gamma-delta |
| 10398 | 2003.06.30 | 1 | N04E52 | 0010 | AXX | ||
| 10399 | 2003.06.30 | 3 | 7 | N16E40 | 0030 | CSO | |
| 10400 | 2003.07.01 | 1 | 1 | N05E69 | 0080 | HSX | formerly region S196 |
| S197 | emerged on 2003.07.01 |
6 | S13W15 | 0020 | BXO | ||
| Total spot count: | 48 | 74 | |||||
| SSN: | 138 | 164 | |||||
| Month | Average solar flux at Earth |
International sunspot number | Smoothed sunspot number |
|---|---|---|---|
| 2000.04 | 184.2 | 125.5 | 120.8 cycle 23 sunspot max. |
| 2000.07 | 202.3 | 170.1 | 119.8 |
| 2001.12 | 235.1 | 132.2 | 114.6 (-0.9) |
| 2002.06 | 148.7 | 88.3 | 106.2 (-2.6) |
| 2002.07 | 173.5 | 99.6 | 102.7 (-3.5) |
| 2002.08 | 183.6 | 116.4 | 98.7 (-4.0) |
| 2002.09 | 175.8 | 109.6 | 94.6 (-4.1) |
| 2002.10 | 167.0 | 97.5 | 90.5 (-4.1) |
| 2002.11 | 168.7 | 95.5 | 85.2 (-5.3) |
| 2002.12 | 157.2 | 80.8 | 82.0 (-3.2) |
| 2003.01 | 144.0 | 79.7 | (79.7 predicted, -2.3) |
| 2003.02 | 124.5 | 46.0 | (74.7 predicted, -5.0) |
| 2003.03 | 131.4 | 61.1 | (69.0 predicted, -5.7) |
| 2003.04 | 126.4 | 60.0 | (64.1 predicted, -4.9) |
| 2003.05 | 115.7 | 55.2 | (59.2 predicted, -4.9) |
| 2003.06 | 129.3 | 77.4 | (55.2 predicted, -4.0) |
| 2003.07 | 131.1 (1) | 4.5 (2) | (51.6 predicted, -3.6) |
1) Running average based on the daily 20:00 UTC observed solar flux value at 2800 MHz.
2) Unofficial, accumulated value based on the Boulder (NOAA/SEC) sunspot number. The official international sunspot number is typically
30-50% less.
This report has been prepared by Jan Alvestad. It is based partly on my own observations and interpretations, and partly on data from sources noted in solar links. All time references are to the UTC day. Comments and suggestions are always welcome.
| [DX-Listeners' Club] |