
Last update January 12, 2003 at 04:00 UTC.
[Solar and geomagnetic data
- last 4 weeks (updated daily)]
[Solar wind and electron
fluence charts (updated daily)]
[Solar cycles 21-23 (last
update January 1, 2003)]
[Solar cycles 1-20]
[Graphical comparison of
cycles 21, 22 and 23 (last update January 1, 2003)]
[Graphical comparison of
cycles 10, 13, 17, 20 and 23 (last update January 1, 2003)]
[Historical solar and geomagnetic
data charts 1954-2002 (last update October 13, 2002)]
[Archived reports (last update January 6, 2003)]
The geomagnetic field was quiet to unsettled on January 11. Solar wind speed ranged between 388 and 486 km/sec under the influence of a fairly benign coronal stream.
Solar flux measured at 20h UTC on 2.8 GHz was 188.8. The planetary A
index was 10 (STAR Ap - based on the mean of three hour interval ap indices: 11.8).
Three hour interval K indices: 33112333 (planetary), 33112223 (Boulder).
The background x-ray flux is at the class B8 level.
At midnight there were 10 spotted regions on the visible disk, 1 of which has not yet been numbered. Solar flare activity was low. A total of 16 C class events were recorded during the day.
Region 10242 decayed further losing penumbral area and spots except in the part of the trailing spot section which has a
magnetic delta structure. An M class flare is possible. Flares:
C2.5 long duration event peaking at 00:42, C1.4 at 04:44, C1.9 at 13:15 , C2.3 at 16:11 and C1.6 at 22:51 UTC.
Region 10244 developed during the first half of the day as new flux emerged, then decayed slowly during the latter half
of the day. Flares: C2.7 at 10:29, C3.0 at 10:55, C2.3 at 11:11 and C2.4 at 19:33 UTC.
Region 10247 decayed in the trailing and leading spot sections. Some development was observed in the intermediate spot
section as negative magnetic flux emerged near the northern edge of the main positive polarity area. A minor M class flare is possible.
Flare:
C1.7 at 17:44 UTC.
Region 10249 reemerged quickly during the latter half of the day.
Region 10250 increased its penumbral coverage slightly, no other significant changes were observed.
Region 10251 increased the area of the leading penumbra while the trailing penumbra split into 3 smaller penumbrae. An M class flare is
possible. Flare:
C1.2 at 03:40 UTC.
Region 10252 decayed slowly and could soon become spotless.
Region 10253 decayed significantly and could soon become spotless.
Region 10254 developed slowly. A magnetically positive area just southeast of the leading negative penumbra became
stronger and several spots emerged. If this development continues a magnetic delta will form soon.
Spotted regions not yet numbered by SEC/NOAA:
[S72] A new region emerged late on January 10 in the northwest quadrant just southeast of region 10253. The region had only a
couple of spots at midnight and developed slowly early on January 11. Slow decay was observed later in the day. Location at midnight:
N07W47.
January 9-11: No obviously geoeffective CMEs observed.
Coronal hole history (since late October 2002)
Compare today's report with the situation one solar rotation ago: 28
days ago 27 days ago 26 days ago
No obvious coronal holes are currently approaching geoeffective positions.
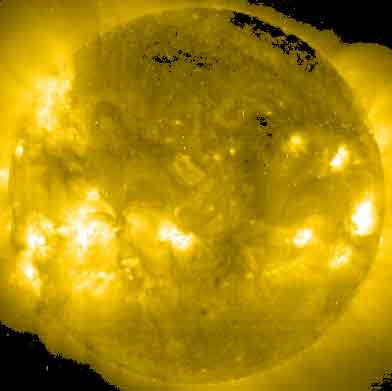
Processed SOHO EIT 284 image at 01:06 UTC on January 12. Any black areas on the solar disk are likely coronal holes.
The geomagnetic field is expected to be quiet to unsettled on January 12-14. Long distance medium wave (AM) band propagation along east-west paths over high and upper middle latitudes is fair to poor.
| Coronal holes (1) | Coronal mass ejections (2) | M and X class flares (3) |
1) Effects from a coronal hole could reach Earth within the
next 5 days.
2) Material from a CME is likely to impact Earth within 96 hours.
3) There is a possibility of either M or X class flares within the next 48
hours.
Green: 0-20% probability, Yellow: 20-60% probability, Red: 60-100% probability.

Composite image based on a SOHO/MDI continuum image and overlaid by a coronal hole image. Region numbering has been included. Compare to the previous day's image.
Data for all numbered solar regions according to the Solar Region Summary provided by SEC/NOAA. Comments are my own, as is the STAR spot count (spots observed at or inside a few hours before midnight) and data for regions not numbered by SEC or where SEC has observed no spots.
| Solar region | Date numbered | SEC spot count |
STAR spot count |
Location at midnight | Area | Classification | Comment |
|---|---|---|---|---|---|---|---|
| 10242 | 2003.01.02 | 28 | 22 | S07W61 | 0300 | DAI | beta-gamma-delta |
| 10244 | 2003.01.03 | 4 | 4 | S22W56 | 0020 | CAO | |
| 10245 | 2003.01.03 | N12W33 | |||||
| 10246 | 2003.01.06 | N09W54 | plage | ||||
| 10247 | 2003.01.06 | 46 | 31 | S17E07 | 0300 | EAI | |
| 10249 | 2003.01.07 | 4 | 3 | S15W34 | 0020 | HAX |
classification was DAO at midnight, area 0060 |
| 10250 | 2003.01.07 | 7 | 5 | S27E27 | 0180 | CKO | |
| 10251 | 2003.01.07 | 34 | 15 | S14E32 | 0380 | EKO | beta-gamma |
| 10252 | 2003.01.09 | 3 | 1 | S03E33 | 0020 | HAX |
classification was HRX at midnight, area 0010 |
| 10253 | 2003.01.10 | 11 | 3 | N11W51 (SEC: N09W48) |
0060 | DAO |
location corrected, SEC spot count includes those of region S72 classification was CRO at midnight, area 0020 |
| 10254 | 2003.01.10 | 11 | 9 | S16E63 | 0190 | EAO | beta-gamma |
| S68 | emerged on 2003.01.04 |
N02W46 | plage | ||||
| S69 | emerged on 2003.01.05 |
N13W77 | plage | ||||
| S72 | emerged on 2003.01.10 |
3 | N07W47 | 0030 | CAO | ||
| Total spot count: | 148 | 96 | |||||
| SSN: | 238 | 196 | |||||
| Month | Average solar flux at Earth |
International sunspot number | Smoothed sunspot number |
|---|---|---|---|
| 2000.04 | 184.2 | 125.5 | 120.8 cycle 23 sunspot max. |
| 2000.07 | 202.3 | 170.1 | 119.8 |
| 2001.12 | 235.1 | 132.2 | 114.6 (-0.9) |
| 2002.01 | 226.6 | 114.1 | 113.5 (-1.1) |
| 2002.02 | 205.0 | 107.4 | 114.6 (+1.2) |
| 2002.03 | 179.5 | 98.4 | 113.3 (-1.3) |
| 2002.04 | 189.8 | 120.7 | 110.5 (-2.9) |
| 2002.05 | 178.4 | 120.8 | 108.8 (-1.7) |
| 2002.06 | 148.7 | 88.3 | 106.2 (-2.6) |
| 2002.07 | 173.5 | 99.6 | (102.1 predicted, -4.1) |
| 2002.08 | 183.6 | 116.4 | (98.5 predicted, -3.6) |
| 2002.09 | 175.8 | 109.6 | (95.5 predicted, -3.0) |
| 2002.10 | 167.0 | 97.5 | (92.0 predicted, -3.5) |
| 2002.11 | 168.7 | 95.0 | (86.7 predicted, -5.3) |
| 2002.12 | 157.2 | 81.6 | (82.4 predicted, -4.3) |
| 2003.01 | 156.1 (1) | 53.4 (2) | (79.4 predicted, -3.0) |
1) Running average based on the daily 20:00 UT observed solar flux value at 2800
MHz.
2) Unofficial, accumulated value based on the Boulder (SEC/NOAA) sunspot number. The official
international sunspot number is typically 25-45% less.
This report has been prepared by Jan Alvestad. It is based partly on my own observations and interpretations, and partly on data from sources noted in solar links. All time references are to the UTC day. Comments and suggestions are always welcome.
| [DX-Listeners' Club] |