
Last update January 11, 2003 at 04:30 UTC.
[Solar and geomagnetic data
- last 4 weeks (updated daily)]
[Solar wind and electron
fluence charts (updated daily)]
[Solar cycles 21-23 (last
update January 1, 2003)]
[Solar cycles 1-20]
[Graphical comparison of
cycles 21, 22 and 23 (last update January 1, 2003)]
[Graphical comparison of
cycles 10, 13, 17, 20 and 23 (last update January 1, 2003)]
[Historical solar and geomagnetic
data charts 1954-2002 (last update October 13, 2002)]
[Archived reports (last update January 6, 2003)]
The geomagnetic field was quiet to unsettled on January 10. Solar wind speed ranged between 337 and 492 km/sec under the influence of a fairly benign coronal stream.
Solar flux measured at 20h UTC on 2.8 GHz was 184.7. The planetary A
index was 10 (STAR Ap - based on the mean of three hour interval ap indices: 11.4).
Three hour interval K indices: 22223333 (planetary), 322223333 (Boulder).
The background x-ray flux is at the class B8 level.
At midnight there were 9 spotted regions on the visible disk, 1 of which has not yet been numbered. Solar flare activity was low. A total of 8 C class events were recorded during the day. A C2.0 event at 14:50 UTC appears to have had its origin behind the southwest limb. Optically uncorrelated flares were recorded at 16:22 (C1.0). 18:11 (C1.7) and 19:05 UTC (C1.2).
Region 10242 decayed slowly in most parts of the region, however, a magnetic delta formed in a central penumbra. This
central part developed slowly adding spots and penumbral area. The region is clearly the most interesting one of those on the
visible disk. An M class flare is possible. Flares:
C3.0 at 22:07 and C2.5 at 23:41 UTC.
Region 10244 decayed slowly and was mostly quiet. Flare: C1.2 at 03:04 UTC.
Region 10247 decayed slowly and quietly. The positive and negative polarity areas, having been narrowly separated over
the previous few days, began to drift apart. A minor M class flare is still possible.
Region 10250 lost most of the small spots which had emerged one day earlier, the main penumbra was mostly unchanged.
Region 10251 added some penumbral area in the trailing penumbra and was otherwise mostly unchanged. An M class flare is
possible.
Region 10252 developed slowly and quietly.
New region 10253 emerged in the northwest quadrant.
New region 10254 rotated fully into view at the southeast limb.
Spotted regions not yet numbered by SEC/NOAA:
[S72] A new region emerged late in the day in the northwest quadrant just southeast of region 10253. The region had only a
couple of spots at midnight, several new spots are visible early on January 11. Location at midnight: N07W32.
January 8-10: No obviously geoeffective CMEs observed.
Coronal hole history (since late October 2002)
Compare today's report with the situation one solar rotation ago: 28
days ago 27 days ago 26 days ago
A small coronal hole in the northern hemisphere may have been in a geoeffective position on January 10 and the associated coronal stream may weakly influence the geomagnetic field on January 13.

Processed SOHO EIT 284 image at 01:06 UTC on January 11. Any black areas on the solar disk are likely coronal holes.
The geomagnetic field is expected to be quiet to active on January 11 and quiet to unsettled on January 12-14. Long distance medium wave (AM) band propagation along east-west paths over high and upper middle latitudes is fair to poor.
| Coronal holes (1) | Coronal mass ejections (2) | M and X class flares (3) |
1) Effects from a coronal hole could reach Earth within the
next 5 days.
2) Material from a CME is likely to impact Earth within 96 hours.
3) There is a possibility of either M or X class flares within the next 48
hours.
Green: 0-20% probability, Yellow: 20-60% probability, Red: 60-100% probability.
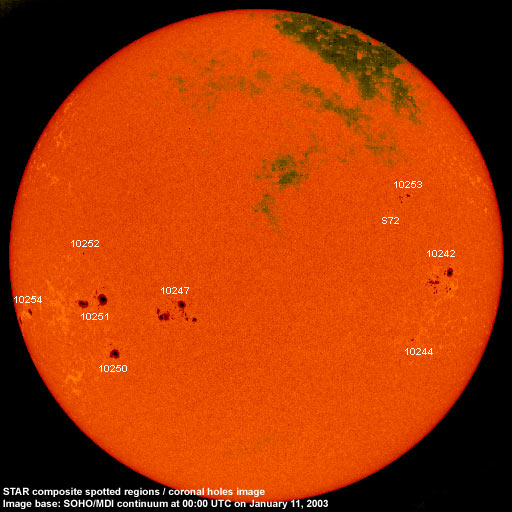
Composite image based on a SOHO/MDI continuum image and overlaid by a coronal hole image. Region numbering has been included. Compare to the previous day's image.
Data for all numbered solar regions according to the Solar Region Summary provided by SEC/NOAA. Comments are my own, as is the STAR spot count (spots observed at or inside a few hours before midnight) and data for regions not numbered by SEC or where SEC has observed no spots.
| Solar region | Date numbered | SEC spot count |
STAR spot count |
Location at midnight | Area | Classification | Comment |
|---|---|---|---|---|---|---|---|
| 10242 | 2003.01.02 | 23 | 33 | S08W48 | 0190 | DAI |
beta-gamma-delta
area was near 0300 at midnight |
| 10244 | 2003.01.03 | 3 | 2 | S22W44 | 0010 | CSO |
classification was HSX at midnight, area 0020 |
| 10245 | 2003.01.03 | 3 | N12W20 | 0010 | CAO | now spotless | |
| 10246 | 2003.01.06 | N09W41 | plage | ||||
| 10247 | 2003.01.06 | 33 | 45 | S15E20 | 0300 | EAI |
area was approx. 0470 at midnight |
| 10248 | 2003.01.07 | S10W82 | plage | ||||
| 10249 | 2003.01.07 | 11 | S15W21 | 0040 | DAO | now spotless | |
| 10250 | 2003.01.07 | 7 | 6 | S26E37 | 0170 | CAO |
classification was DKO at midnight |
| 10251 | 2003.01.07 | 12 | 25 | S13E44 | 0340 | EHO |
beta-gamma classification was FKO at midnight, area 0460 |
| 10252 | 2003.01.09 | 2 | 2 | S03E46 | 0020 | HSX |
classification was CSO at midnight |
| 10253 | 2003.01.10 | 4 | 8 | N11W36 | 0010 | CSO |
classification was DAO at midnight, area 0050 |
| 10254 | 2003.01.10 | 1 | 6 | S15E72 | 0070 | HSX |
formerly region S71 classification was EAO at midnight, area 0140 |
| S68 | emerged on 2003.01.04 |
N02W33 | plage | ||||
| S69 | emerged on 2003.01.05 |
N13W64 | plage | ||||
| S72 | emerged on 2003.01.10 |
2 | N07W32 | 0010 | BXO | ||
| Total spot count: | 99 | 129 | |||||
| SSN: | 199 | 219 | |||||
| Month | Average solar flux at Earth |
International sunspot number | Smoothed sunspot number |
|---|---|---|---|
| 2000.04 | 184.2 | 125.5 | 120.8 cycle 23 sunspot max. |
| 2000.07 | 202.3 | 170.1 | 119.8 |
| 2001.12 | 235.1 | 132.2 | 114.6 (-0.9) |
| 2002.01 | 226.6 | 114.1 | 113.5 (-1.1) |
| 2002.02 | 205.0 | 107.4 | 114.6 (+1.2) |
| 2002.03 | 179.5 | 98.4 | 113.3 (-1.3) |
| 2002.04 | 189.8 | 120.7 | 110.5 (-2.9) |
| 2002.05 | 178.4 | 120.8 | 108.8 (-1.7) |
| 2002.06 | 148.7 | 88.3 | 106.2 (-2.6) |
| 2002.07 | 173.5 | 99.6 | (102.1 predicted, -4.1) |
| 2002.08 | 183.6 | 116.4 | (98.5 predicted, -3.6) |
| 2002.09 | 175.8 | 109.6 | (95.5 predicted, -3.0) |
| 2002.10 | 167.0 | 97.5 | (92.0 predicted, -3.5) |
| 2002.11 | 168.7 | 95.0 | (86.7 predicted, -5.3) |
| 2002.12 | 157.2 | 81.6 | (82.4 predicted, -4.3) |
| 2003.01 | 152.9 (1) | 45.7 (2) | (79.4 predicted, -3.0) |
1) Running average based on the daily 20:00 UT observed solar flux value at 2800
MHz.
2) Unofficial, accumulated value based on the Boulder (SEC/NOAA) sunspot number. The official
international sunspot number is typically 25-45% less.
This report has been prepared by Jan Alvestad. It is based partly on my own observations and interpretations, and partly on data from sources noted in solar links. All time references are to the UTC day. Comments and suggestions are always welcome.
| [DX-Listeners' Club] |