
Last update issued on February 28, 2003 at 04:00 UTC.
[Solar and geomagnetic data
- last 4 weeks (updated daily)]
[Solar wind and electron
fluence charts (updated daily)]
[Solar cycles 21-23 (last
update February 2, 2003)]
[Solar cycles 1-20]
[Graphical comparison of
cycles 21, 22 and 23 (last update February 2, 2003)]
[Graphical comparison of
cycles 10, 13, 17, 20 and 23 (last update February 2, 2003)]
[Historical solar and geomagnetic
data charts 1954-2002 (last update January 27, 2003)]
[Archived reports (last update February 24, 2003)]
The geomagnetic field was unsettled to active on February 27. Solar wind speed ranged between 448 and 662 km/sec under the influence of a high speed stream.
Solar flux measured at 20h UTC on 2.8 GHz was 117.6. The planetary A
index was 22 (STAR Ap - based on the mean of three hour interval ap indices: 22.6).
Three hour interval K indices: 44334434 (planetary), 54333443 (Boulder).
The background x-ray flux is at the class B4 level.
At midnight there were 6 spotted regions on the visible disk, 1 of which has not yet been numbered by SEC/NOAA. Solar flare activity was low. A total of 2 C class events was recorded during the day, including a C1.2 flare in region 10288 at 01:58 UTC.
Region 10290 decayed slowly and quietly and will rotate out of view at the northwest limb late today.
Region 10292 decayed slowly and quietly and could soon become spotless.
New region 10293 emerged early on February 26 in the southeast quadrant and was numbered the next day. The region has
decayed and could soon become spotless.
New region 10294 emerged early on February 26 in the southeast quadrant and was numbered the next day. This region
developed fairly quickly on Feb.27 and has C class flare potential.
New region 10295 rotated into view at the southeast limb on February 26 and was numbered the next day. Slow development was
observed on Feb.27.
Spotted regions not yet numbered by SEC/NOAA:
[S111] A new region rotated into view at the northeast limb late on Feb.27. This region has a large penumbra and could
produce C and perhaps minor M class flares. Location
at midnight: N09E84. Flare: C3.4 at 23:52 UTC.
February 27: No obviously geoeffective CMEs observed (new LASCO images became available towards the end of the day).
Coronal hole history (since late October 2002)
Compare today's report with the situation one solar rotation ago: 28
days ago 27 days ago 26
days ago
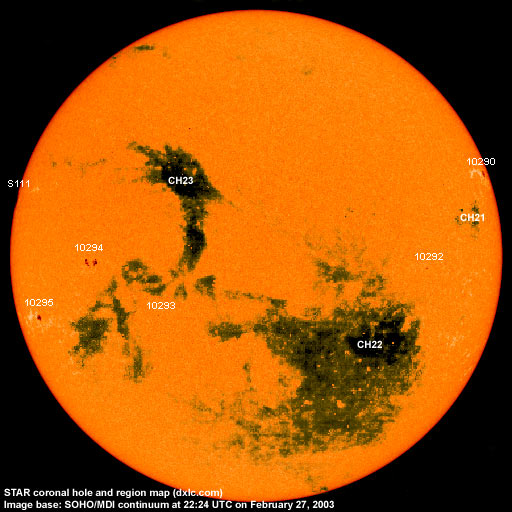
A recurrent, trans equatorial coronal hole (CH21) was in a geoeffective position on February 23-24. The northernmost part of a coronal hole (CH22) in the southern hemisphere may have been geoeffective on February 26-27. A coronal hole (CH23) in the northern hemisphere with a trans equatorial extension will rotate into a geoeffective position on March 1. A collection of smaller coronal holes in the southern hemisphere could become geoeffective on March 2.

Processed SOHO EIT 284 image at 01:06 UTC on February 28. Any black areas on the solar disk are likely coronal holes.
The geomagnetic field is expected to be quiet to active on February 28-March 2 due to high speed streams from coronal holes (CH21 and CH22). Long distance medium wave (AM) band propagation along east-west paths over high and upper middle latitudes is very poor, propagation along north-south paths is fair. [Propagation conditions are currently monitored every night. Main monitoring frequency: 1470 kHz. Dominant station tonight: Radio Cristal del Uruguay.]
| Coronal holes (1) | Coronal mass ejections (2) | M and X class flares (3) |
1) Effects from a coronal hole could reach Earth within the
next 5 days.
2) Material from a CME is likely to impact Earth within 96 hours.
3) There is a possibility of either M or X class flares within the next 48
hours.
Green: 0-20% probability, Yellow: 20-60% probability, Red: 60-100% probability.
Compare to the previous day's image.
Data for all numbered solar regions according to the Solar Region Summary provided by SEC/NOAA. Comments are my own, as is the STAR spot count (spots observed at or inside a few hours before midnight) and data for regions not numbered by SEC or where SEC has observed no spots.
| Solar region | Date numbered | SEC spot count |
STAR spot count |
Location at midnight | Area | Classification | Comment |
|---|---|---|---|---|---|---|---|
| 10288 | 2003.02.15 | 1 | N14W94 | 0030 | HSX |
no spots observed at any time during the day |
|
| 10290 | 2003.02.18 | 6 | 3 | N18W75 | 0080 | CAO |
classification was HAX at midnight, area 0050 |
| 10291 | 2003.02.21 | S23W73 | plage | ||||
| 10292 | 2003.02.25 | 3 | 1 | S07W42 | 0020 | CSO |
classification was HRX at midnight, area 0010 |
| 10293 | 2003.02.27 | 3 | 1 | S21E26 | 0010 | BXO |
formerly region S109 classification was AXX at midnight, area 0000 |
| 10294 | 2003.02.27 | 6 | 15 | S08E42 | 0040 | CAO |
formerly region S108 classification was DAO at midnight, area 0090 |
| 10295 | 2003.02.27 | 3 | 2 | S19E65 | 0070 | CAO |
formerly region S110 classification was HAX at midnight |
| S105 | emerged on 2003.02.20 |
S28W81 | plage | ||||
| S106 | emerged on 2003.02.23 |
S06W33 | plage | ||||
| S111 | visible on 2003.02.27 |
1 | N09E83 | 0170 | HSX | ||
| Total spot count: | 22 | 23 | |||||
| SSN: | 82 | 83 | |||||
| Month | Average solar flux at Earth |
International sunspot number | Smoothed sunspot number |
|---|---|---|---|
| 2000.04 | 184.2 | 125.5 | 120.8 cycle 23 sunspot max. |
| 2000.07 | 202.3 | 170.1 | 119.8 |
| 2001.12 | 235.1 | 132.2 | 114.6 (-0.9) |
| 2002.01 | 226.6 | 114.1 | 113.5 (-1.1) |
| 2002.02 | 205.0 | 107.4 | 114.6 (+1.2) |
| 2002.03 | 179.5 | 98.4 | 113.3 (-1.3) |
| 2002.04 | 189.8 | 120.7 | 110.5 (-2.9) |
| 2002.05 | 178.4 | 120.8 | 108.8 (-1.7) |
| 2002.06 | 148.7 | 88.3 | 106.2 (-2.6) |
| 2002.07 | 173.5 | 99.6 | 102.7 (-3.5) |
| 2002.08 | 183.6 | 116.4 | (99.7 predicted, -3.0) |
| 2002.09 | 175.8 | 109.6 | (96.7 predicted, -3.0) |
| 2002.10 | 167.0 | 97.5 | (93.2 predicted, -3.5) |
| 2002.11 | 168.7 | 95.0 | (88.0 predicted, -5.2) |
| 2002.12 | 157.2 | 81.6 | (83.6 predicted, -4.4) |
| 2003.01 | 144.0 | 79.5 | (80.6 predicted, -3.0) |
| 2003.02 | 124.5 (1) | 85.3 (2) | (75.5 predicted, -5.1) |
1) Running average based on the daily 20:00 UT observed solar flux value at 2800
MHz.
2) Unofficial, accumulated value based on the Boulder (SEC/NOAA) sunspot number. The official
international sunspot number is typically 25-45% less.
This report has been prepared by Jan Alvestad. It is based partly on my own observations and interpretations, and partly on data from sources noted in solar links. All time references are to the UTC day. Comments and suggestions are always welcome.
| [DX-Listeners' Club] |