
Last update issued on February 19, 2003 at 04:15 UTC.
[Solar and geomagnetic data
- last 4 weeks (updated daily)]
[Solar wind and electron
fluence charts (updated daily)]
[Solar cycles 21-23 (last
update February 2, 2003)]
[Solar cycles 1-20]
[Graphical comparison of
cycles 21, 22 and 23 (last update February 2, 2003)]
[Graphical comparison of
cycles 10, 13, 17, 20 and 23 (last update February 2, 2003)]
[Historical solar and geomagnetic
data charts 1954-2002 (last update January 27, 2003)]
[Archived reports (last update February 17, 2003)]
The geomagnetic field was quiet to active on February 18. Solar wind speed ranged between 556 and 954 km/sec at SOHO. There was an unusual solar wind disturbance at 08h UTC. For the remainder of the day the interplanetary magnetic field was northwards. This disturbance temporarily shut off the coronal hole based stream which had been in progress until just prior to the arrival of the disturbance. The source of the disturbance is not obvious but reexamination of LASCO C3 movies hints at the possibility of a faint full halo CME late on February 16.
Solar flux measured at 20h UTC on 2.8 GHz was 109.9. The planetary A
index was 17 (STAR Ap - based on the mean of three hour interval ap indices: 18.9).
Three hour interval K indices: 24343323 (planetary), 25352213 (Boulder).
The background x-ray flux is at the class B2 level.
At midnight there were 3 spotted regions on the visible disk. Solar flare activity was very low. No C class flares were observed and the only event of interest was a B9.8 flare in region 10289 at 08:41 UTC.
Region 10288 lost the trailing spots while slow development was observed in the leading spots.
New region 10289 emerged on February 17 and was numbered the next day. This region is developing quickly and could soon
become capable of producing minor M class flares.
New region 10290 emerged northeast of region 10288 and has developed fairly quickly.
February 16-17: No obviously geoeffective CMEs observed. There may have been a faint full halo CME late on February 16. Its source is not obvious.
February 18: A large filament eruption in the northwest quadrant (near the northwest limb) was observed beginning at 01:55 UTC. This eruption was associated with a CME off of the northwest limb.
Coronal hole history (since late October 2002)
Compare today's report with the situation one solar rotation ago: 28
days ago 27 days ago 26
days ago
A trans equatorial coronal hole and a southern polar coronal hole extension was in a geoeffective position on February 12-18.
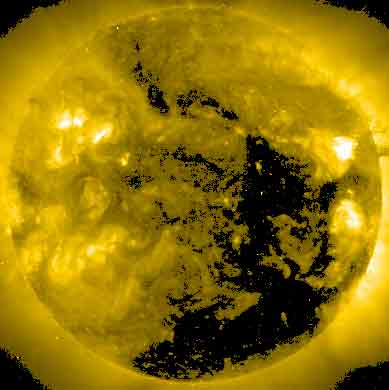
Processed SOHO EIT 284 image at 01:06 UTC on February 19. Any black areas on the solar disk are likely coronal holes.
The geomagnetic field is expected to be quiet to active with occasional minor storm intervals until February 21. Long distance medium wave (AM) band propagation along east-west paths over high and upper middle latitudes is very poor, propagation along north-south paths is fair.
| Coronal holes (1) | Coronal mass ejections (2) | M and X class flares (3) |
1) Effects from a coronal hole could reach Earth within the
next 5 days.
2) Material from a CME is likely to impact Earth within 96 hours.
3) There is a possibility of either M or X class flares within the next 48
hours.
Green: 0-20% probability, Yellow: 20-60% probability, Red: 60-100% probability.

Compare to the previous day's image.
Data for all numbered solar regions according to the Solar Region Summary provided by SEC/NOAA. Comments are my own, as is the STAR spot count (spots observed at or inside a few hours before midnight) and data for regions not numbered by SEC or where SEC has observed no spots.
| Solar region | Date numbered | SEC spot count |
STAR spot count |
Location at midnight | Area | Classification | Comment |
|---|---|---|---|---|---|---|---|
| 10281 | 2003.02.06 | S15W84 | plage | ||||
| 10285 | 2003.02.08 | S12W53 | plage | ||||
| 10288 | 2003.02.15 | 10 | 4 | N12E32 | 0030 | DSO |
classification was HSX at midnight, area 0040 |
| 10289 | 2003.02.18 | 7 | 8 | N11W52 | 0020 | CAO |
formerly region S103 area was 0080 at midnight |
| 10290 | 2003.02.18 | 4 | 8 | N17E46 | 0010 | CRO |
classification was DAO at midnight, area 0040 |
| S100 | emerged on 2003.02.13 |
N11W30 | plage | ||||
| S101 | emerged on 2003.02.15 |
S03W52 | plage | ||||
| S102 | emerged on 2003.02.15 |
S08E01 | plage | ||||
| Total spot count: | 21 | 20 | |||||
| SSN: | 51 | 50 | |||||
| Month | Average solar flux at Earth |
International sunspot number | Smoothed sunspot number |
|---|---|---|---|
| 2000.04 | 184.2 | 125.5 | 120.8 cycle 23 sunspot max. |
| 2000.07 | 202.3 | 170.1 | 119.8 |
| 2001.12 | 235.1 | 132.2 | 114.6 (-0.9) |
| 2002.01 | 226.6 | 114.1 | 113.5 (-1.1) |
| 2002.02 | 205.0 | 107.4 | 114.6 (+1.2) |
| 2002.03 | 179.5 | 98.4 | 113.3 (-1.3) |
| 2002.04 | 189.8 | 120.7 | 110.5 (-2.9) |
| 2002.05 | 178.4 | 120.8 | 108.8 (-1.7) |
| 2002.06 | 148.7 | 88.3 | 106.2 (-2.6) |
| 2002.07 | 173.5 | 99.6 | 102.7 (-3.5) |
| 2002.08 | 183.6 | 116.4 | (99.7 predicted, -3.0) |
| 2002.09 | 175.8 | 109.6 | (96.7 predicted, -3.0) |
| 2002.10 | 167.0 | 97.5 | (93.2 predicted, -3.5) |
| 2002.11 | 168.7 | 95.0 | (88.0 predicted, -5.2) |
| 2002.12 | 157.2 | 81.6 | (83.6 predicted, -4.4) |
| 2003.01 | 144.0 | 79.5 | (80.6 predicted, -3.0) |
| 2003.02 | 131.5 (1) | 66.6 (2) | (75.5 predicted, -5.1) |
1) Running average based on the daily 20:00 UT observed solar flux value at 2800
MHz.
2) Unofficial, accumulated value based on the Boulder (SEC/NOAA) sunspot number. The official
international sunspot number is typically 25-45% less.
This report has been prepared by Jan Alvestad. It is based partly on my own observations and interpretations, and partly on data from sources noted in solar links. All time references are to the UTC day. Comments and suggestions are always welcome.
| [DX-Listeners' Club] |