
Last major update issued on December 2, 2003 at 04:45 UTC. Minor update posted at 12:53 UTC.
[Solar and geomagnetic data - last month (updated daily)]
[Solar wind and electron fluence charts (updated daily)]
[Solar cycles 21-23 (last update December 2, 2003)]
[Solar cycles 1-20]
[Graphical comparison of cycles 21, 22 and 23 (last update December 2, 2003)]
[Graphical comparison of cycles 2, 10, 13, 17, 20 and 23 (last update December
2, 2003)]
[Historical solar and geomagnetic data charts 1954-2003 (last update October 15, 2003)]
[Archived reports (last update December 1, 2003)]
The geomagnetic field was quiet to unsettled on December 1. Solar wind speed ranged between 387 and 495 km/sec.
Solar flux measured at 20h UTC on 2.8 GHz was 143.3. The planetary A
index was 10 (STAR Ap - based on the mean of three hour interval ap indices: 11.4).
Three hour interval K indices: 23333322 (planetary), 23323222 (Boulder).
The background x-ray flux is at the class B5 level.
At midnight there were 8 spotted regions on the visible disk. Solar flare activity was low. A total of 3 C class events were recorded during the day.
Region 10508 rotated out of view at the southwest limb. Flares: C1.3 at 04:49 and C1.3 at
15:03 UTC.
Region 10509 decayed slowly and quietly.
Region 10510 decayed further and lost most of the spots. Flare: C1.1 at 18:43 UTC.
Region 10511 was quiet and stable.
Region 10513 was quiet and stable.
Region 10515 developed moderately quickly as new flux emerged in both polarities.
Region 10516 spread out over a larger area but with little change in penumbral area.
Region 10517 was quiet and stable.
Spotted regions not numbered by NOAA/SEC:
[S318] A new region emerged southeast of region 10516 on November 30. Location at midnight: S22E34.
Comment added at 12:53 UTC on December 2: Region 10508 at the southwest limb has been quite active today and the source of a long duration C8 event peaking at about 11:30 UTC. Further activity is being observed as I write this and this could soon result in an M class event. The events inn region 10508 have caused a notable increase in the above 10 MeV proton flux and a proton event could start soon.
November 29 - December 1: No partly or fully earth directed CMEs observed.
Coronal hole history (since late October 2002)
Compare today's report with the situation one solar rotation ago: 28
days ago 27 days ago 26 days ago
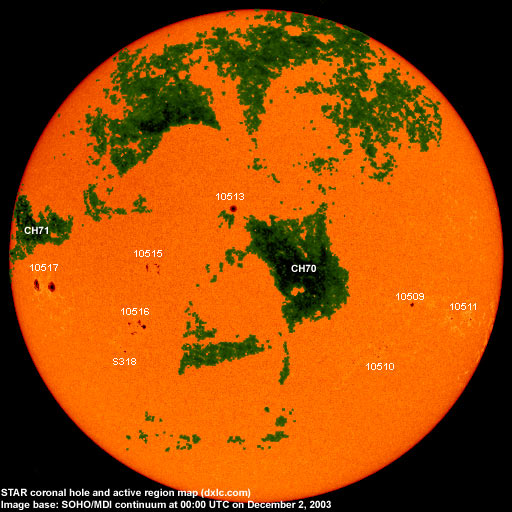
A recurrent trans equatorial coronal hole (CH70) was in a geoeffective position on November 30 and December 1. A large recurrent trans equatorial coronal hole (CH71) is rotating into view at the east limb and will likely reach a geoeffective position on December 5 or 6 with the associated high speed stream influencing the Earth from December 7 or 8.

Processed SOHO/EIT 284 image at 01:05 UTC on December 2. The darkest areas on the solar disk are likely coronal holes.
The geomagnetic field is expected to be quiet to unsettled on December 2. On December 3-4 unsettled to major storm conditions are likely due to a high speed stream from coronal hole CH70. Quiet to active is likely on December 5 with geomagnetic conditions becoming quiet to unsettled on December 6-7. A strong high speed stream from coronal hole CH71 should dominate the solar wind from December 8 until approximately December 15.
Long distance low frequency (below 2 MHz) propagation along east-west paths over high and upper middle latitudes is poor. Propagation along long distance north-south paths is poor to very poor. [Trans Atlantic propagation conditions are currently monitored every night on 1470 kHz. Dominant station tonight: Radio Vibracion with WLAM Lewiston ME (with WMTW programming) noted at times].
| Coronal holes (1) | Coronal mass ejections (2) | M and X class flares (3) |
1) Effects from a coronal hole could reach Earth within the next 5 days. When the high speed stream has arrived
the color changes to green.
2) Material from a CME is likely to impact Earth within 96 hours.
3) There is a possibility of either M or X class flares within the next 48 hours.
Green: 0-20% probability, Yellow: 20-60% probability, Red: 60-100% probability.
Compare to the previous day's image.
Data for all numbered solar regions according to the Solar Region Summary provided by NOAA/SEC. Comments are my own, as is the STAR spot count (spots observed at or inside a few hours before midnight) and data for regions not numbered by SEC or where SEC has observed no spots. SEC active region numbers in the table below and in the active region map above are the historic SEC/USAF numbers.
| Active region | Date numbered | SEC spot count |
STAR spot count |
Location at midnight | Area | Classification | Comment |
|---|---|---|---|---|---|---|---|
| 10507 | 2003.11.18 | 2 | N07W95 | 0150 | DAO | rotated out of view | |
| 10508 | 2003.11.19 | 8 | S19W84 | 0140 | CSO | rotated out of view | |
| 10509 | 2003.11.24 | 4 | 2 | S11W37 | 0040 | CSO |
classification was HSX at midnight |
| 10510 | 2003.11.24 | 22 | 11 | S23W29 | 0040 | CRO | |
| 10511 | 2003.11.25 | 6 | 4 | S15W57 | 0040 | DSO | |
| 10512 | 2003.11.25 | N06W49 | plage | ||||
| 10513 | 2003.11.26 | 1 | 1 | N13E05 | 0070 | HSX | |
| 10515 | 2003.11.28 | 9 | 13 | S02E28 | 0050 | DSO |
classification was DAO at midnight |
| 10516 | 2003.11.28 | 12 | 9 | S17E31 | 0060 | DSO |
classification was DAO at midnight |
| 10517 | 2003.11.30 | 5 | 6 | S07E60 | 0260 | DKO |
classification was DAO at midnight |
| S314 | emerged on 2003.11.27 |
S15W30 | plage | ||||
| S318 | emerged on 2003.11.30 |
4 | S22E34 | 0020 | CSO | ||
| Total spot count: | 69 | 50 | |||||
| SSN: | 159 | 130 | |||||
| Month | Average solar flux at Earth |
International sunspot number | Smoothed sunspot number |
|---|---|---|---|
| 2000.04 | 184.2 | 125.5 | 120.8 cycle 23 sunspot max. |
| 2000.07 | 202.3 | 170.1 | 119.8 |
| 2001.12 | 235.1 | 132.2 | 114.6 (-0.9) |
| 2002.11 | 168.7 | 95.5 | 85.2 (-5.3) |
| 2002.12 | 157.2 | 80.8 | 82.0 (-3.2) |
| 2003.01 | 144.0 | 79.7 | 80.9 (-1.1) |
| 2003.02 | 124.5 | 46.0 | 78.5 (-2.4) |
| 2003.03 | 131.4 | 61.1 | 74.1 (-4.4) |
| 2003.04 | 126.4 | 60.0 | 70.3 (-3.8) |
| 2003.05 | 115.7 | 55.2 | 67.8 (-2.5) |
| 2003.06 | 129.3 | 77.4 | (65.3 predicted, -2.5) |
| 2003.07 | 127.7 | 85.0 | (61.9 predicted, -3.4) |
| 2003.08 | 122.1 | 72.7 | (59.0 predicted, -2.9) |
| 2003.09 | 112.2 | 48.8 | (57.0 predicted, -2.0) |
| 2003.10 | 151.7 | 65.6 | (54.3 predicted, -2.7) |
| 2003.11 | 140.8 | 67.2 | (51.6 predicted, -2.7) |
| 2003.12 | 143.3 (1) | 5.1 (2) | (49.0 predicted, -2.6) |
1) Running average based on the daily 20:00 UTC observed solar flux value at 2800 MHz.
2) Unofficial, accumulated value based on the Boulder (NOAA/SEC) sunspot number. The official international sunspot number is typically
30-50% less.
This report has been prepared by Jan Alvestad. It is based partly on my own observations and analysis, and partly on data from sources noted in solar links. All time references are to the UTC day. Comments and suggestions are always welcome.
| [DX-Listeners' Club] |