
Last update issued on August 21, 2003 at 03:55 UTC.
[Solar and geomagnetic data - last month (updated daily)]
[Solar wind and electron fluence charts (updated daily)]
[Solar cycles 21-23 (last update August 18, 2003)]
[Solar cycles 1-20]
[Graphical comparison of cycles 21, 22 and 23 (last update August 18, 2003)]
[Graphical comparison of cycles 2, 10, 13, 17, 20 and 23 (last update August
18, 2003)]
[Historical solar and geomagnetic data charts 1954-2003 (last update July 23, 2003)]
[Archived reports (last update August 1, 2003)]
The geomagnetic field was quiet to active on August 20. Solar wind speed ranged between 386 and 561 km/sec. Solar wind density increased slowly all day and peaked near 22h UTC. At this time a high speed stream from coronal hole CH52 began dominating the solar wind. Solar wind speed has increased to above 600 km/sec early on August 21.
Solar flux measured at 20h UTC on 2.8 GHz was 111.8. The planetary A
index was 15 (STAR Ap - based on the mean of three hour interval ap indices: 15.6).
Three hour interval K indices: 23423334 (planetary), 23423434 (Boulder).
The background x-ray flux is at the class B3 level.
At midnight there were 6 spotted regions on the visible disk. Solar flare activity was very low.
Region 10433 reemerged with a single spot.
Region 10436 developed slowly in the leading and intermediate spot section while slow decay continued in the trailing
spot section.
Spotted regions not numbered by NOAA/SEC:
[S232] A new region emerged in the southwest quadrant on August 20. This region is a reversed polarity region. Location at
midnight: S32W24.
[S233] A new region emerged in the northwest quadrant near the center of the visible disk (and is visible in a coronal
island inside coronal hole CH52 in an image below) on August 20. Location at midnight: N07W13.
[S234] A new region emerged in the southeast quadrant on August 19 and developed slowly on August 20. Location at midnight:
S08E20.
[S235] A new region emerged in the northeast quadrant on August 20. Location at midnight: N12E59.
August 18-20: No potentially geoeffective CMEs observed.
Coronal hole history (since late October 2002)
Compare today's report with the situation one solar rotation ago: 28
days ago 27 days ago 26 days ago
A large coronal hole (CH52) in the northern hemisphere will be in a geoeffective position on August 17-21, the eastern part is the most well defined part. A recurrent coronal hole (CH53) in the southern hemisphere is rotating into view at the southeast limb, it is not yet obvious if some part of this coronal hole will reach geoeffective positions.
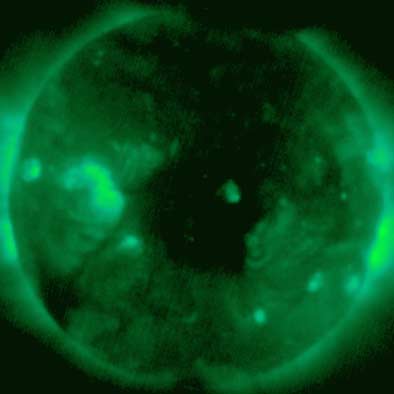
Processed GOES SXI coronal structure image at 00:00 UTC on August 21. Base SXI image courtesy of NOAA/SEC. The darkest areas on the solar disk are likely coronal holes.
The geomagnetic field is expected to be unsettled to major storm until August 25 due to a high speed stream from coronal hole CH52.
Long distance low frequency (below 2 MHz) propagation along east-west paths over high and upper middle latitudes is very poor. Propagation along north-south paths is poor to fair. [Trans Atlantic propagation conditions are currently monitored every night on 1470 kHz. Dominant station tonight: Radio Cristal del Uruguay, Radio Vibraci�n (Venezuela) was observed at times.]
| Coronal holes (1) | Coronal mass ejections (2) | M and X class flares (3) |
1) Effects from a coronal hole could reach Earth within the next 5 days.
2) Material from a CME is likely to impact Earth within 96 hours.
3) There is a possibility of either M or X class flares within the next 48 hours.
Green: 0-20% probability, Yellow: 20-60% probability, Red: 60-100% probability.

Compare to the previous day's image.
Data for all numbered solar regions according to the Solar Region Summary provided by NOAA/SEC. Comments are my own, as is the STAR spot count (spots observed at or inside a few hours before midnight) and data for regions not numbered by SEC or where SEC has observed no spots.
| Solar region | Date numbered | SEC spot count |
STAR spot count |
Location at midnight | Area | Classification | Comment |
|---|---|---|---|---|---|---|---|
| 10431 | 2003.08.09 | 5 | S10W84 | 0100 | CSO | rotated out of view | |
| 10432 | 2003.08.13 | S03W25 | plage | ||||
| 10433 | 2003.08.14 | 1 | 1 | S20W58 | 0000 | AXX | |
| 10434 | 2003.08.15 | S23W59 | plage | ||||
| 10436 | 2003.08.17 | 15 | 27 | N07E29 | 0120 | EAO |
classification was FAO at midnight |
| 10437 | 2003.08.19 | 1 | S22W39 | 0010 | AXX | spotless | |
| S230 | emerged on 2003.08.17 |
S03W34 | plage | ||||
| S232 | emerged on 2003.08.20 |
4 | S32W24 | 0020 | CSO | reversed polarity | |
| S233 | emerged on 2003.08.20 |
5 | N07W13 | 0020 | CSO | ||
| S234 | emerged on 2003.08.19 |
3 | S08E20 | 0010 | BXO | ||
| S235 | emerged on 2003.08.20 |
6 | N12E59 | 0030 | CAO | ||
| Total spot count: | 22 | 46 | |||||
| SSN: | 62 | 106 | |||||
| Month | Average solar flux at Earth |
International sunspot number | Smoothed sunspot number |
|---|---|---|---|
| 2000.04 | 184.2 | 125.5 | 120.8 cycle 23 sunspot max. |
| 2000.07 | 202.3 | 170.1 | 119.8 |
| 2001.12 | 235.1 | 132.2 | 114.6 (-0.9) |
| 2002.07 | 173.5 | 99.6 | 102.7 (-3.5) |
| 2002.08 | 183.6 | 116.4 | 98.7 (-4.0) |
| 2002.09 | 175.8 | 109.6 | 94.6 (-4.1) |
| 2002.10 | 167.0 | 97.5 | 90.5 (-4.1) |
| 2002.11 | 168.7 | 95.5 | 85.2 (-5.3) |
| 2002.12 | 157.2 | 80.8 | 82.0 (-3.2) |
| 2003.01 | 144.0 | 79.7 | 81.0 (-1.0) |
| 2003.02 | 124.5 | 46.0 | (77.2 predicted, -3.8) |
| 2003.03 | 131.4 | 61.1 | (71.5 predicted, -5.7) |
| 2003.04 | 126.4 | 60.0 | (66.6 predicted, -4.9) |
| 2003.05 | 115.7 | 55.2 | (61.7 predicted, -4.9) |
| 2003.06 | 129.3 | 77.4 | (57.7 predicted, -4.0) |
| 2003.07 | 127.7 | 85.0 | (54.1 predicted, -3.6) |
| 2003.08 | 124.3 (1) | 70.6 (2) | (52.3 predicted, -1.8) |
1) Running average based on the daily 20:00 UTC observed solar flux value at 2800 MHz.
2) Unofficial, accumulated value based on the Boulder (NOAA/SEC) sunspot number. The official international sunspot number is typically
30-50% less.
This report has been prepared by Jan Alvestad. It is based partly on my own observations and analysis, and partly on data from sources noted in solar links. All time references are to the UTC day. Comments and suggestions are always welcome.
| [DX-Listeners' Club] |