
Last update issued on August 20, 2003 at 04:20 UTC.
[Solar and geomagnetic data - last month (updated daily)]
[Solar wind and electron fluence charts (updated daily)]
[Solar cycles 21-23 (last update August 18, 2003)]
[Solar cycles 1-20]
[Graphical comparison of cycles 21, 22 and 23 (last update August 18, 2003)]
[Graphical comparison of cycles 2, 10, 13, 17, 20 and 23 (last update August
18, 2003)]
[Historical solar and geomagnetic data charts 1954-2003 (last update July 23, 2003)]
[Archived reports (last update August 1, 2003)]
The geomagnetic field was quiet to major storm on August 19. Solar wind speed ranged between 391 and 511 km/sec.
Solar flux measured at 20h UTC on 2.8 GHz was 116.7. The planetary A
index was 21 (STAR Ap - based on the mean of three hour interval ap indices: 21.6).
Three hour interval K indices: 64332333 (planetary), 54333333 (Boulder).
The background x-ray flux is at the class B3 level.
At midnight there were 3 spotted regions on the visible disk. Solar flare activity was moderate. A total of 5 C and 2 M class events was recorded during the day.
Region 10431 decayed further and became quiet after the second M class flare of the day. The region will be rotating over
the southwest limb today and tomorrow. Flares: C1.1 at 04:27, impulsive M2.0/1N at
07:59, C2.8 at 08:52, C2.0 at 09:15, a long duration M2.7/2F event peaking at 10:06 and C1.0 at 17:46 UTC. The M2.7 event was
associated with a weak type IV and a moderate type II radio sweep.
Region 10436 gained some small intermediate spots and decayed slowly in the trailing spot section. Flare:
C5.6 at 18:26 UTC.
New region 10437 emerged in the southwest quadrant on August 18 and was numbered by SEC the next day. The region appears to
be decaying.
August 18-19: No potentially geoeffective CMEs observed.
August 17: A slow partial CME observed off the southern hemisphere limbs and the south pole during the evening was not obviously associated with frontside activity in SOHO EIT or SXI images. This well defined CME probably had a backsided origin.
Coronal hole history (since late October 2002)
Compare today's report with the situation one solar rotation ago: 28
days ago 27 days ago 26 days ago
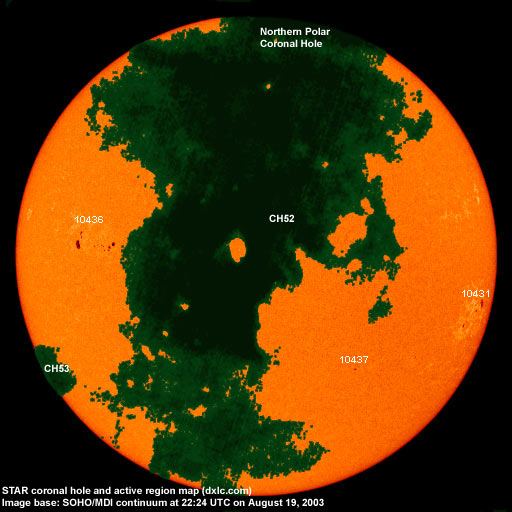
A large coronal hole (CH52) in the northern hemisphere will be in a geoeffective position on August 17-21, the eastern part is the most well defined part. A recurrent coronal hole (CH53) in the southern hemisphere is rotating into view at the southeast linb.
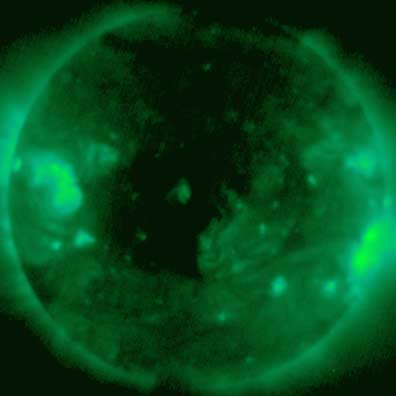
Processed GOES SXI coronal structure image at 22:21 UTC on August 19. Base SXI image courtesy of NOAA/SEC. The darkest areas on the solar disk are likely coronal holes.
The geomagnetic field is expected to be quiet to unsettled early on August 20. A high speed stream from coronal hole CH52 will likely arrive during the latter half of the day and cause mostly unsettled to minor storm conditions until August 24 or 25.
Long distance low frequency (below 2 MHz) propagation along east-west paths over high and upper middle latitudes is useless. Propagation along north-south paths is poor. [Trans Atlantic propagation conditions are currently monitored every night on 1470 kHz. Dominant station tonight: Radio Cristal del Uruguay.]
| Coronal holes (1) | Coronal mass ejections (2) | M and X class flares (3) |
1) Effects from a coronal hole could reach Earth within the next 5 days.
2) Material from a CME is likely to impact Earth within 96 hours.
3) There is a possibility of either M or X class flares within the next 48 hours.
Green: 0-20% probability, Yellow: 20-60% probability, Red: 60-100% probability.
Compare to the previous day's image.
Data for all numbered solar regions according to the Solar Region Summary provided by NOAA/SEC. Comments are my own, as is the STAR spot count (spots observed at or inside a few hours before midnight) and data for regions not numbered by SEC or where SEC has observed no spots.
| Solar region | Date numbered | SEC spot count |
STAR spot count |
Location at midnight | Area | Classification | Comment |
|---|---|---|---|---|---|---|---|
| 10431 | 2003.08.09 | 12 | 11 | S11W67 | 0180 | EAI |
beta-gamma area was 0100 at midnight |
| 10432 | 2003.08.13 | 1 | S03W12 | 0010 | HSX | spotless | |
| 10433 | 2003.08.14 | 1 | S19W45 | 0010 | HRX | spotless | |
| 10434 | 2003.08.15 | S23W46 | plage | ||||
| 10435 | 2003.08.16 | S17W80 | plage | ||||
| 10436 | 2003.08.17 | 12 | 18 | N08E42 | 0160 | EAO | |
| 10437 | 2003.08.19 | 1 | 2 | S22W27 | 0010 | HRX | formerly region S231 |
| S230 | emerged on 2003.08.17 |
S03W21 | plage | ||||
| Total spot count: | 27 | 31 | |||||
| SSN: | 77 | 61 | |||||
| Month | Average solar flux at Earth |
International sunspot number | Smoothed sunspot number |
|---|---|---|---|
| 2000.04 | 184.2 | 125.5 | 120.8 cycle 23 sunspot max. |
| 2000.07 | 202.3 | 170.1 | 119.8 |
| 2001.12 | 235.1 | 132.2 | 114.6 (-0.9) |
| 2002.06 | 148.7 | 88.3 | 106.2 (-2.6) |
| 2002.07 | 173.5 | 99.6 | 102.7 (-3.5) |
| 2002.08 | 183.6 | 116.4 | 98.7 (-4.0) |
| 2002.09 | 175.8 | 109.6 | 94.6 (-4.1) |
| 2002.10 | 167.0 | 97.5 | 90.5 (-4.1) |
| 2002.11 | 168.7 | 95.5 | 85.2 (-5.3) |
| 2002.12 | 157.2 | 80.8 | 82.0 (-3.2) |
| 2003.01 | 144.0 | 79.7 | 81.0 (-1.0) |
| 2003.02 | 124.5 | 46.0 | (77.2 predicted, -3.8) |
| 2003.03 | 131.4 | 61.1 | (71.5 predicted, -5.7) |
| 2003.04 | 126.4 | 60.0 | (66.6 predicted, -4.9) |
| 2003.05 | 115.7 | 55.2 | (61.7 predicted, -4.9) |
| 2003.06 | 129.3 | 77.4 | (57.7 predicted, -4.0) |
| 2003.07 | 127.7 | 85.0 | (54.1 predicted, -3.6) |
| 2003.08 | 125.0 (1) | 68.6 (2) | (52.3 predicted, -1.8) |
1) Running average based on the daily 20:00 UTC observed solar flux value at 2800 MHz.
2) Unofficial, accumulated value based on the Boulder (NOAA/SEC) sunspot number. The official international sunspot number is typically
30-50% less.
This report has been prepared by Jan Alvestad. It is based partly on my own observations and analysis, and partly on data from sources noted in solar links. All time references are to the UTC day. Comments and suggestions are always welcome.
| [DX-Listeners' Club] |